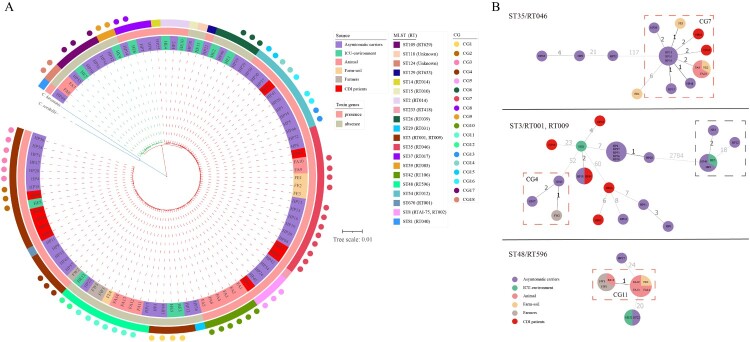
Figure 3.
Phylogenetic analysis and CG distribution. A. Maximum likelihood phylogenetic tree of 98 C. difficile strains based on the core genome. The differently coloured branches represent two MLST clade strains: the red branches belong to MLST clade 1, and the green branches belong to MLST clade 4. The blue branches were Clostridium hiranonis (C. hiranonis) and Clostridium sordellii (C. sordellii), which were used as outgroups to root the tree. Coloured rings from the inside out represent the sources of the strains, presence or absence of toxin genes, and STs. Coloured dots represent the distribution of CGs. B. Minimum spanning trees of strains in ST35/RT046, ST3/RT001, RT009, and ST48/RT596. The colours of the circles represent the sources, and sizes of the circles are related to the number of strains in the CG: the more strains in the CG, the larger the size. Values between the circles are the number of cgSNPs, where smaller numbers are indicated by values with darker colour. Dashed red square boxes are CGs comprising strains from multiple sources. Strains in dashed black square boxes are non-toxigenic ST3/RT009 strains, while the rest of the ST3/RT001 strains are toxigenic. HP, HE, FA, FE, and FW are strain names, representing strains from hospitalized patients in the ICU including patients with CDI and asymptomatic carriers, the ICU environment, animals, soil, and farmers, respectively.

