Figure 1.

Alcohol Use Disorder oral microbial diversity during treatment
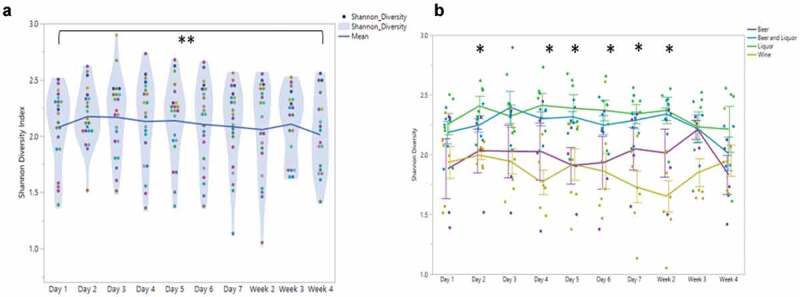
1A) Average Shannon Diversity Index (SDI) at each sampling time point through treatment. Each point represents an individual’s SDI at that sampling time. Each color represents the same patient through treatment. Center horizontal line represents the average SDI across each sampling time point. Comparison between SDI at day 2 and week 4 is significantly different, noted by double asterisk (P< .006).1B) Shannon Diversity index (y-axis) at each sampling time point (x-axis) by alcohol choice. Beer (purple) and wine drinkers (yellow) had lower average SDI during treatment than did beer and liquor (blue) and liquor drinkers (green). Significant SDI changes between alcohol preference types were observed at days 2, 4–7 and week 2. Repeated measures mixed model analysis reported significant main effect of alcohol preference (F: 5.3, P < .008).
