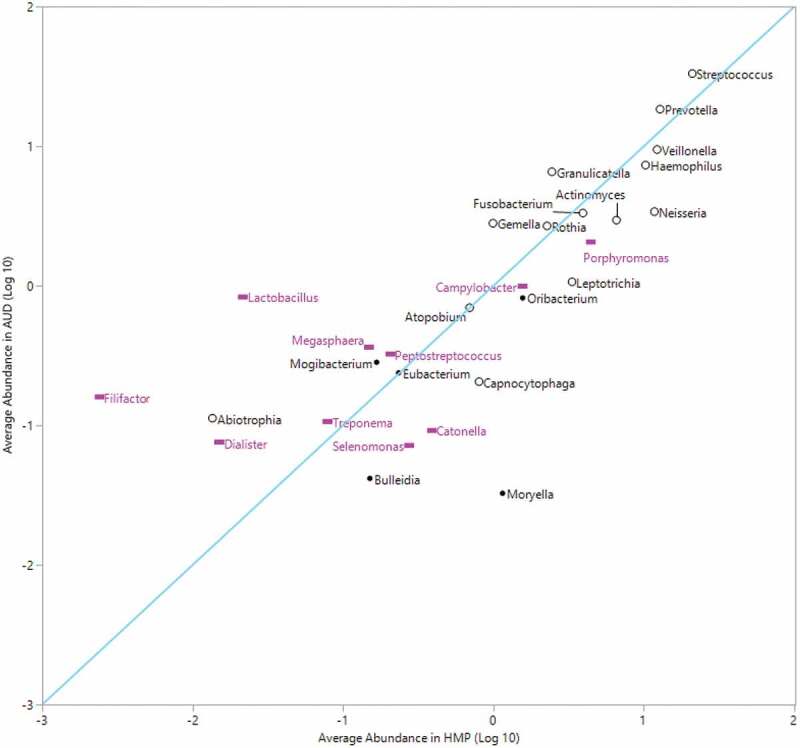
Figure 4.

Average relative abundance of top 20% abundant genera in HMP compared to average abundance in AUD
Correlation between the top 20% average abundance HMP genera (x-axis) versus average abundance in AUD (y-axis). Diagonal line represents line of identity. Correlation coefficient (Pearson r: 0.75). N = 10 filled pink rectangle of periodontitis-associated genera, N = 14 black open circle of health-associated genera. (*missing periodontitis-associated genus Desulfobulbus in figure. Genus not found in the HMP dataset.)
