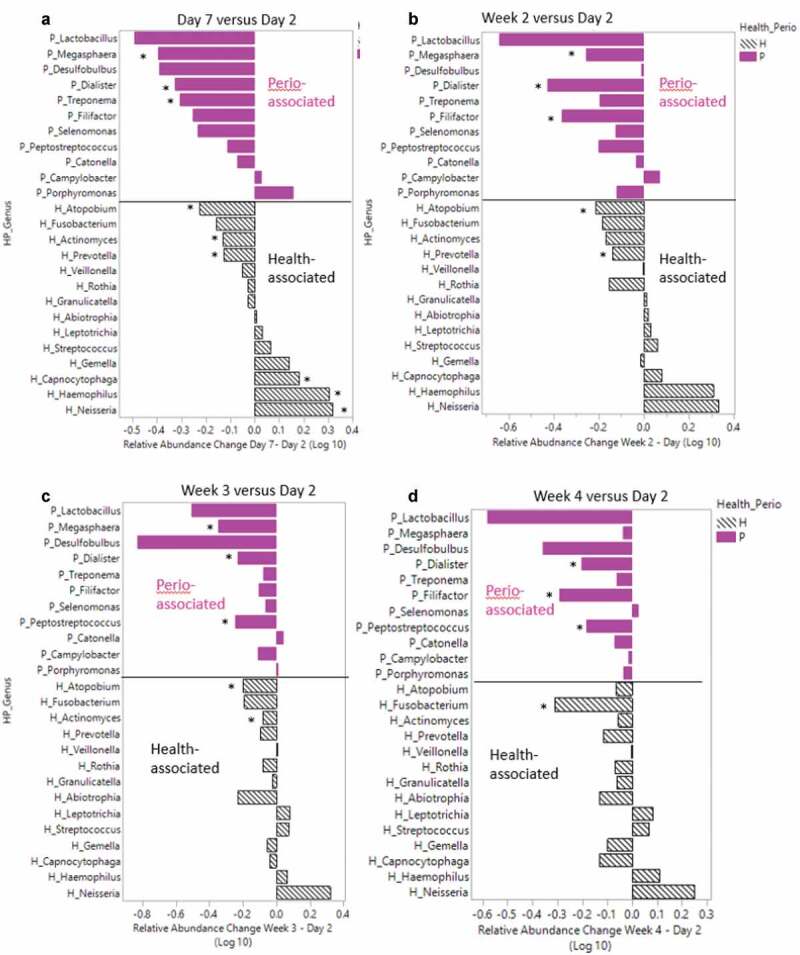
Figure 5.

Health and periodontitis-associated genera relative abundance differences between day 2 versus day 7 and weeks 2–4
Average logarithm base 10 relative abundance difference (y-axis) between 5A) day 7 versus day 2 samples, 5B) week 2 versus day 2, 5 C) week 3 versus day 2, and 5D) week 4 versus day 2. Gray patterned bars represent ‘health’ associated genera and pink solid bars represent ‘periodontal-disease’ associated genera. Asterisk indicates genus that showed significant difference between the associated comparison of interest (day 7 versus day 2, week 2 versus day 2, week 3 versus day 2, week 4 versus day 2). See Supplemental Table 2 for corresponding p values.
