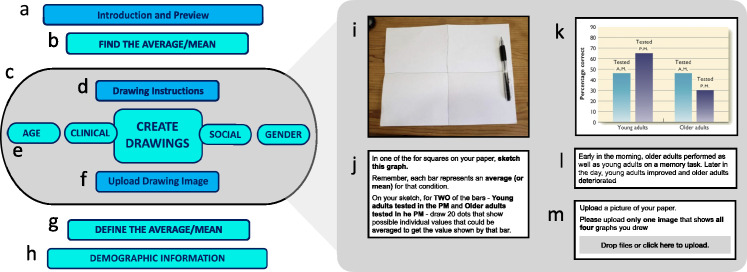
Figure 10.
Flowchart of study procedure. The present study consisted of five main sections (a, b, c, g, h). Sections and subsections colored teal (b, e, g, h) produced data that were analyzed for this study. Subsections on the right (i, j, k, l, m) are an expansion of section c of the flowchart, showing (i) the drawing page, (j) the drawing instructions, (k) one of the four stimulus graphs, (l) the graph caption, and (m) the upload instructions. See Methods for further procedural details.

