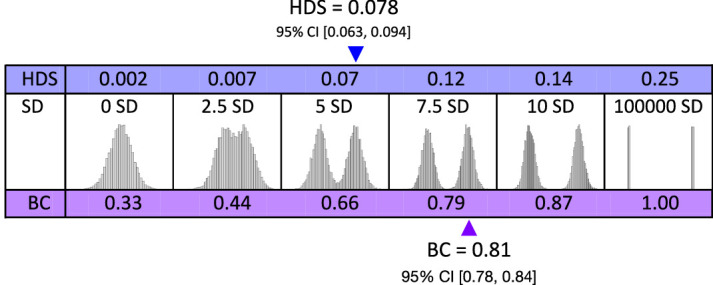
Figure 15.

Two analytic approaches confirm that the BTL index data are strongly bimodal. Distribution graphs show reference data sets where varying degrees of separation were imposed on independently generated normal distributions. Separation is quantified in units of standard deviation (SD). Two standard bimodality statistics for each reference distribution were computed: Hardigan's Dip Statistic (HDS) is shown above in blue; the Bimodality Coefficient (BC) is shown below in purple (Freeman & Dale, 2013; Pfister et al., 2013). HDS and BC for our full data set, marked with arrows at top and bottom, along with 95% CIs, confirm strong BTL index bimodality (Table 4 bimodality statistics provide four internal replications of this overall result).
