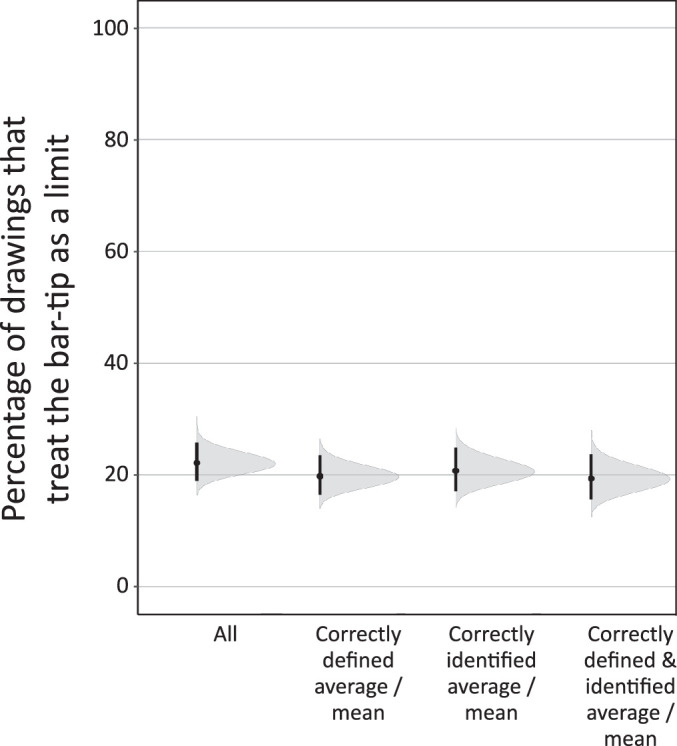
Figure 17.

The Bar-Tip Limit (BTL) error occurs despite correctly defining “mean” and correctly locating it on the graph. Percentage of readouts that showed the BTL error (defined as a BTL index over 80). “All” is the full dataset (n = 551 readouts). “Correctly defined average/mean” is restricted to participants who produced a correct definition for the mean (n = 486 readouts). “Correctly identified average/mean” is restricted to participants who correctly identified a mean value on the same graph that produced the readout (n = 413 readouts). “Correctly defined & identified average/mean” is restricted to participants who both correctly defined the mean and correctly identified a mean value on the graph (n = 367 readouts). In all cases, the proportion of BTL errors hovers around one in five. Vertical lines show 95% CIs, and gray regions show full probability distributions for the uncertainty around the percentage values.
