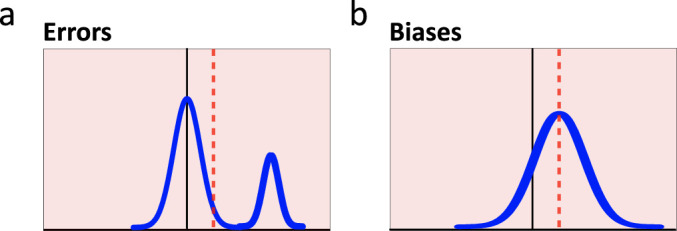
Figure 21.

Even when data clearly indicate the presence of an error, analyses based purely on mean values could misidentify that error as a bias. Shown are visual definitions of (a) errors and (b) biases, using prototypical response distributions (see discussion of Figure 8). Black lines represent the correct response; blue lines represent alternate distributions; red lines represent mean values. Since the mean values do not differ between the two shown distributions, mean value alone is insufficient to distinguish between error and bias.
