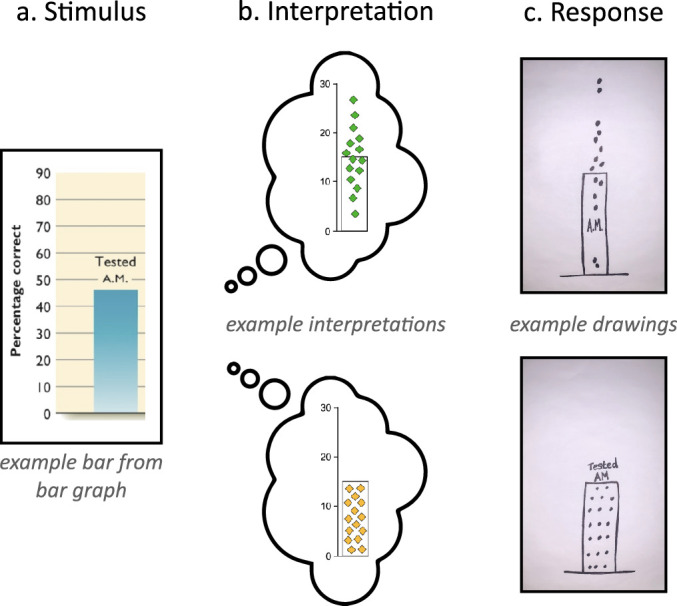
Figure 4.

The Draw Datapoints on Graph (DDoG) measure maintains the graph as a consistent reference frame across its three stages. (a) Participants are presented with a graph stimulus that (b) produces a mental representation of the data; (c) this interpretation is recorded by sketching a version of the graph along with hypothesized locations of individual data values. Drawings are representative examples of the two common responses seen in pilot data collection: the correct Bar-Tip Mean response (top), and the incorrect Bar-Tip Limit (BTL) response (bottom).
