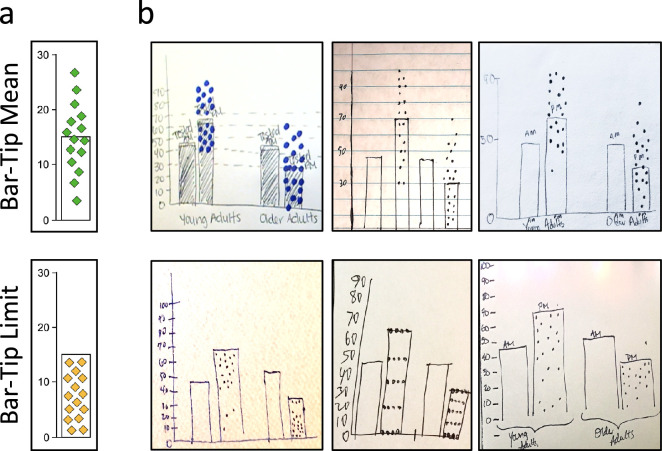
Figure 6.
The difference between Bar-Tip Mean and Bar-Tip Limit thinking is easily observable. (a) Cartoon and (b) readout examples of the two common DDoG measure responses: the correct Bar-Tip Mean response (top) and the incorrect Bar-Tip Limit (BTL) response (bottom). These readouts were all drawn for the same stimulus graph, which we refer to as AGE (see Figure 11).

