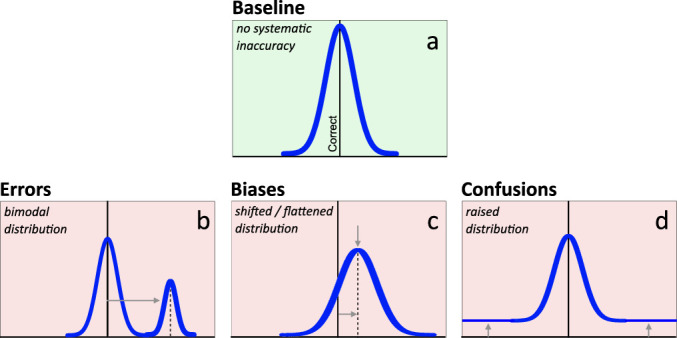
Figure 8.

Three types of inaccurate graph interpretation. Prototypical response distributions provide visual definitions for three types of inaccuracy. Top row: (a) Baseline response pattern (green) indicates no systematic inaccuracy. Responses cluster symmetrically around the correct response value, with imprecision in task input, processing, and output reflected in the width of the spread around that correct response. Bottom row: Light red backgrounds illustrate the presence of inaccurate responses. Gray arrows indicate the major change from the baseline response pattern for each type of inaccurate response. (b) Systematic error responses form their own distinct mode. (c) Systematic bias responses shift and/or flatten the baseline response distribution. (d) Confused responses—expressed as random, unsystematic responding—are uniformly distributed, thus raising the tails of the baseline distribution to a constant value without altering the mean, median, or mode.
