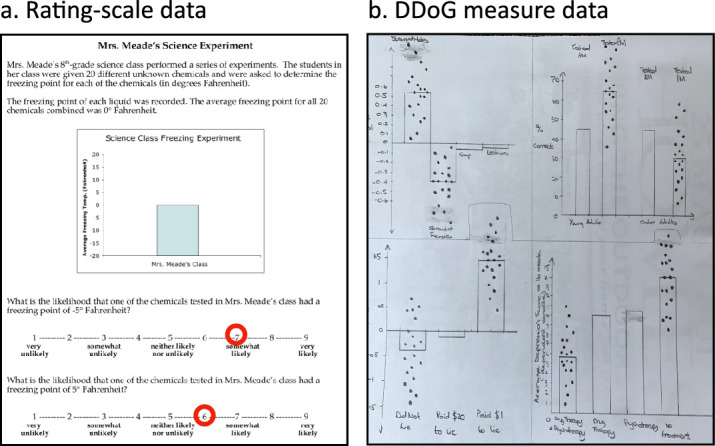
Figure 9.

A side-by-side comparison of a probability rating scale and a DDoG measure response. DDoG measure's more concrete, detailed, visuospatial (aka readout-based) approach may have contributed to the ease with which it identified the BTL error and its apparent conflation mechanism, which were missed by prior studies using the probability rating scale approach. (a) The probability rating scale response sheet provided to each participant in the original report of asymmetry by Newman and Scholl (2012, Study 5). These Likert-style scales, anchored by colloquial English words (from “very unlikely” to “very likely”), were used to characterize the likelihood that individual values occurred at two specific y-axis values, one within the bar (−5) and one outside the bar (+5). The red circles indicate the resulting mean ratings of 6.9 and 6.1 (from Study 5, Newman & Scholl, 2012). (b) The DDoG measure response sheet from an individual participant given four stimulus graphs and asked to sketch each graph along with 20 hypothesized datapoints for two specified bars on the graph.
