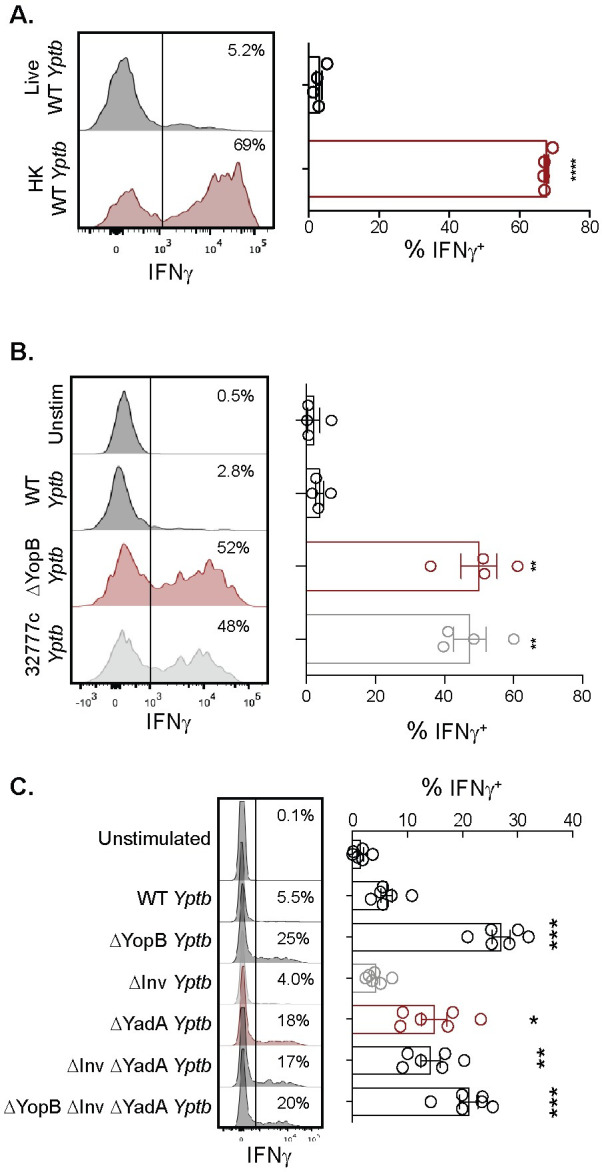
Fig 1. Y. pseudotuberculosis inhibition of Vγ1.1/2- CD44hi CD27- γδ T cell function is YopB- and YadA-dependent.

MLN cell suspensions from L. monocytogenes infected Balb/c mice were left unstimulated or stimulated with 10 MOI of the indicated Y. pseudotuberculosis for 24 hours. Antibiotics were given 2 hours post-stimulation and brefeldin A was added for the last 5 hours of stimulation. Vγ1.1/2- CD44hi CD27- γδ T cells were analyzed for IFNγ production. Representative histograms are displayed. (A) Cells were stimulated with live or heat-killed (HK) wild-type (WT) Y. pseudotuberculosis. The graph depicts the mean ± SEM and represents at least two independent experiments with 4 mice/group/experiment. (B) Cells were stimulated with live WT, ΔYopB, or 32777c Y. pseudotuberculosis. The graph depicts the mean ± SEM and represents at least two independent experiments with 4 mice/group/experiment. (C) Cells were stimulated with WT, ΔYopB, ΔYadA, ΔInv, ΔInv ΔYadA, or ΔYopB ΔInv ΔYadA Y. pseudotuberculosis. The graph depicts the mean ± SEM pooled from two independent experiments with 3 mice/group/experiment. ***p < 0.0001, **p < 0.01, and *p < 0.05. An unpaired t-test was used for (A) and a repeated measures one-way ANOVA was used for (B) and (C). Experimental groups were compared to live WT Y. pseudotuberculosis in (A) and WT Y. pseudotuberculosis in (B) and (C).
