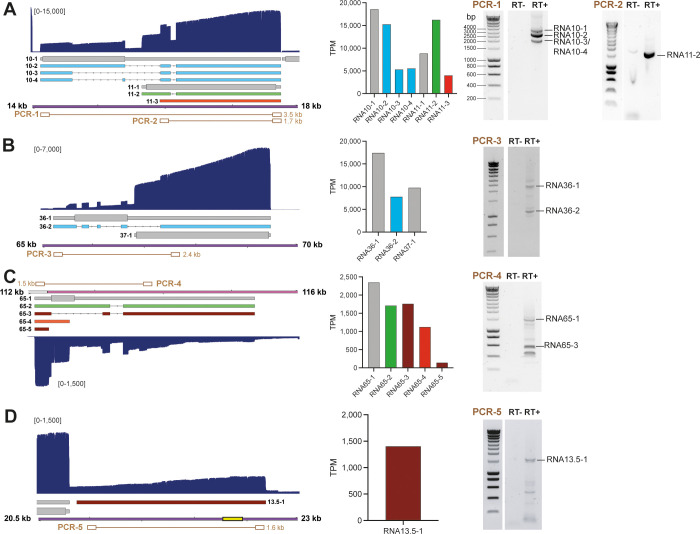
Fig 2. Confirmation of selected novel SVV transcripts by RT-PCR.
(A-D) Examples of a polycistronic transcription units encoding canonical transcripts, novel splice variants and fusion transcripts within the RNA10 and RNA11 locus (A) and RNA36 and RNA 37 (B), canonical, spliced and variant isoforms and putative ncRNAs in the RNA65 locus (C) and newly identified putative ncRNA13.5–1 (D). The structure, location and relative expression levels of novel SVV transcripts are shown, together with agarose gel images of RT-PCRs that confirm their expression. Left panels: Nanopore dRNA-seq coverage plots with annotated SVV transcripts of lytically infected BS-C-1 cells. Canonical with CDS (wide box) and UTR (thin box) in (grey), variant (orange), splice variant (green), fusion transcripts (blue) and non-coding (red) RNAs are indicated. Double black lines represent the SVV genome, with UL in purple fill, US in pink and IRS/TRS no fill, ticks indicate 1 kb intervals and the reiterative repeat regions R1 to R4 and both copies of OriS are indicated as yellow boxes on the genome track. Middle panels: bar graphs indicating transcripts per million (TPM) counts for each transcript isoform. Right panels: RT-PCR was performed on RNA extracted from lytically SVV-infected BS-C-1 cells at 96 hpi. RT+/RT-: reverse transcriptase added or omitted during cDNA synthesis. PCR numbers correspond to primer pairs indicated in brown in Figure A-D and in S5 Table. When multiple bands are observed, sequence confirmed bands are indicated.

