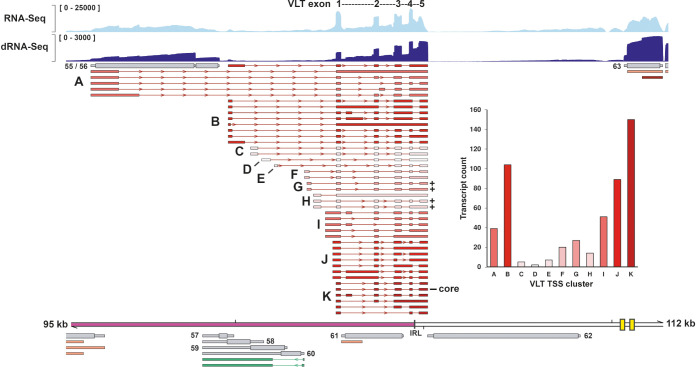
Fig 6. Structure of VLT RNA isoforms expressed during lytic SVV infection of BS-C-1 cells.
VLT isoforms are given are clustered by TSS (A-K). Color gradient indicates relative abundance of transcripts originating from each TSS, and transcript counts are given in the bar graph. Counts only include reads starting within 50 bp from an annotated TSS. Coverage plots show Illumina RNA-seq (light blue) and nanopore dRNA-seq (dark blue) data. Maximum read depth per track is given on the Y-axis. Thick double black lines represent the SVV genome, ticks indicate 10 kb intervals and the reiterative repeat regions R1 to R4 and both copies of OriS are indicated as yellow boxes on the genome track. Plus signs indicate isoforms coding for the longest pVLT homologue and the core VLT is indicated.

