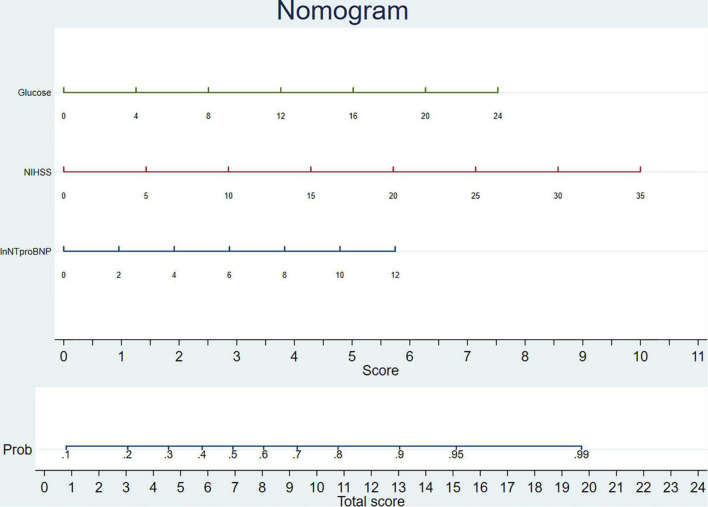
FIGURE 3.
Nomogram of individualized prediction model to predict 3-month poor functional outcome. The nomogram was composed of two areas, the upper area was designed to calculate the total score as the sum of scores for ln(NT-proBNP), National Institutes of Health Stroke Scale (NIHSS), and glucose. The lower area was designed to get the probability of patients to get a poor functional outcome.

