
FIGURE 5.
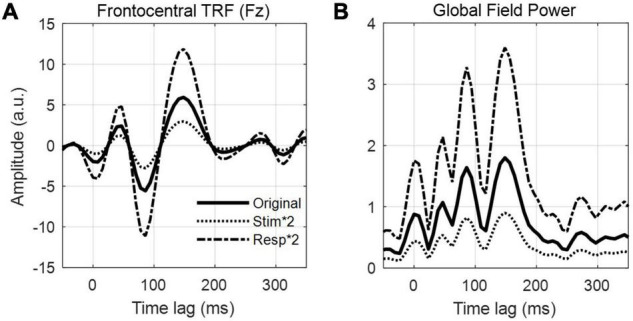
Effects of stimulus-response normalization on TRF amplitude. (A) Frontocentral TRF (channel Fz) calculated from 15 min of speech-EEG data using the envelope feature. The plot shows the TRFs calculated using the original, unnormalized data (bold trace), the stimulus features scaled by a factor of 2 (dotted trace) and the neural response scaled by a factor of 2 (dashed trace). (B) The global field power – calculated as the standard deviation across all 128 EEG channels – for the same 3 conditions as in panel (A).