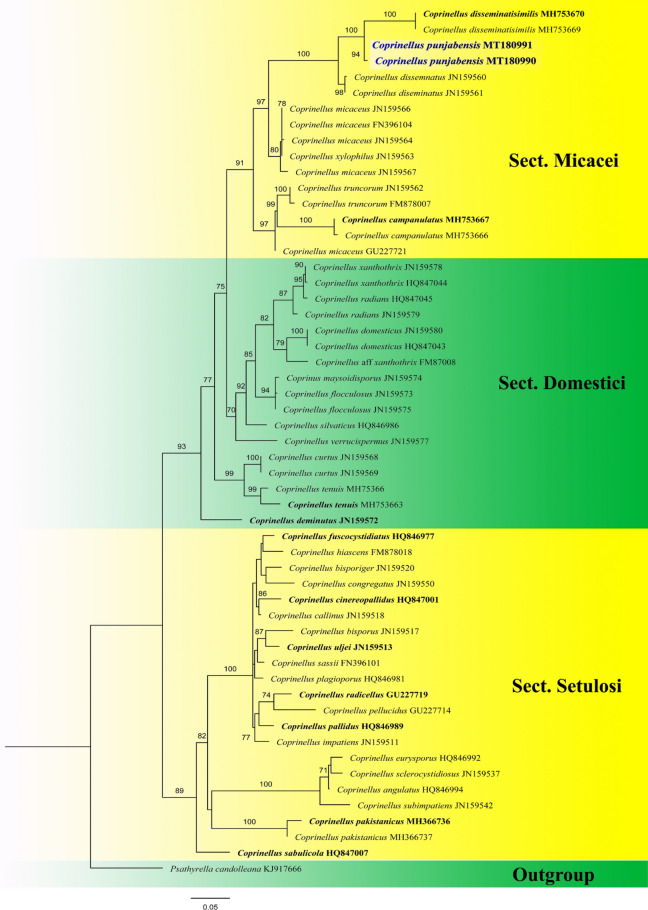
Fig. 201.
Phylogram generated from maximum likelihood analysis based on ITS sequence data representing Coprinellus punjabensis (MT180990) and related species. Related sequences are taken from Hussain et al. (2018). Fifty-five sequences are included in the analysis which comprise 708 characters after alignement. Psathyrella candolleana (KJ917666) is used as the outgroup taxon. The best RAxML tree with a final likelihood values of − 4869.810366 is presented. The matrix had 351 distinct alignment patterns, with 15.82% undetermined characters or gaps. Estimated base frequencies were as follows: A = 0.233377, C = 0.241159, G = 0.233394, T = 0.292070; substitution rates AC = 1.849754, AG = 2.784571, AT = 1.813146, CG = 1.135142, CT = 1.135142, GT = 1.000000; gamma distribution shape parameter α = 0.294349. Bootstrap values for maximum likelihood (MLBS) equal to or greater than 75%. The newly generated sequence is in blue bold

