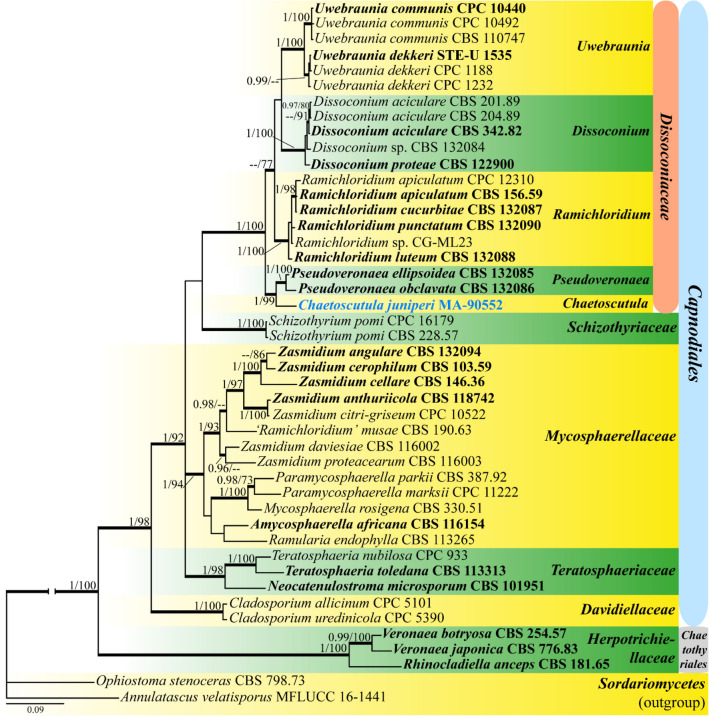
Fig. 4.
Phylogram depicting the evolutionary relationships of Chaetoscutula and related clades in Dissoconiaceae (Capnodiales) based on a three-locus dataset (ITS, LSU and SSU). Species sampling was based on Li et al. (2012). The alignment matrix consisted of 2220 bp and inferred substitution models were GTR + Γ (ITS1 + ITS2), K80 + I + Γ (5.8S, SSU), and GTR + I + Γ (LSU). The represented topology is obtained under a Bayesian framework with MrBayes v.3.2.6. Posterior Probabilities (PP) are represented on branches leading to nodes. Bootstrap support values obtained in a complementary Maximum Likelihood analysis (MLBS, right) with RAxML using 1000 pseudoreplicates are provided after the BYPP values (left). Branches in bold had MLBS equal or greater than 70% and BYPP equal or greater than 0.95. For each terminal, the species name and the voucher/herbarium code are indicated, and type strains are in bold and new isolate is in blue

