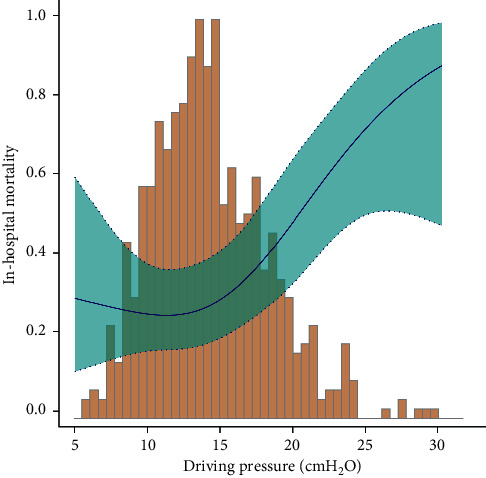
Figure 2.

Nonlinear dose-response relationship between driving pressure and in-hospital mortality. Adjustment factors included age, sex, BMI, heart rate, MAP, WBC, hemoglobin, creatinine, CVP, NT-proBNP, PEEP, PH, PaO2, PaCO2, PF ratio, ventilation mode (CMV), VT/PBW, Elixhauser score, SOFA score, and SAPS score. The blue line and green area represent the estimated values and their corresponding 95% confidence intervals, respectively.
