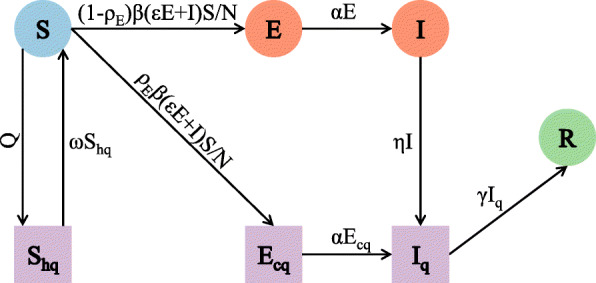
Fig. 1.

Flow patterns between different compartments in the SEIR+q model. Q is the number of comprehensive quarantined persons per day; ω is the rate of release from isolation; ρE is the probability of an exposed person being found and centralized quarantine; β is the average number of infected individuals per day; ε is the transmission coefficient of exposed people (compared with symptomatic people); α is the transition rate from latent infection to symptomatic infection; η is the isolation/confirmed diagnosis rate of symptomatic people; and γ is the transition rate from disease confirmation to recovery or death
