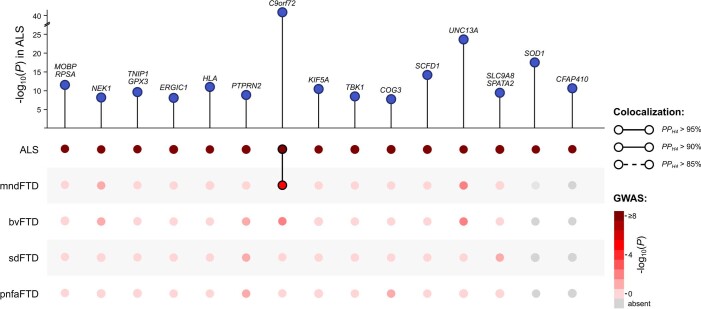
Extended Data Fig. 7. Colocalization analysis with FTD subtypes.
Top associated SNPs in the ALS GWAS were selected for colocalization analysis between ALS and FTD subtypes using COLOC. In the top panel, point height is the two-sided -log10(P-value) of the top-associated SNP in the ALS GWAS. In the bottom panel, association P-values of these SNPs with FTD subtypes are shown by color. The Bayesian posterior probability for a shared causal variant between traits (PPH4) is depicted by a connection between points.

