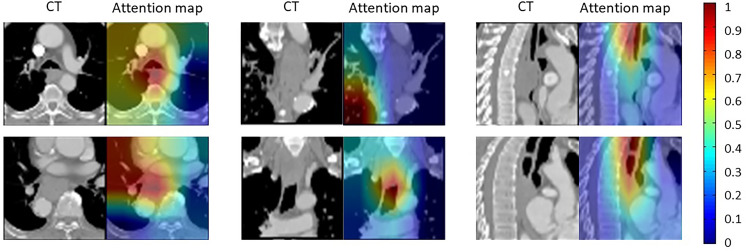
Figure 4.
Visualization of attention maps of six patient examples. The attention heatmap shows the risk model’s focus on esophageal fistula prediction. The hotter areas indicate that the tissues have greater impact on esophageal fistula formation. As shown, the tumor boundaries and the hypoechoic area inside the tumor are more concerned.

