Figure 2.

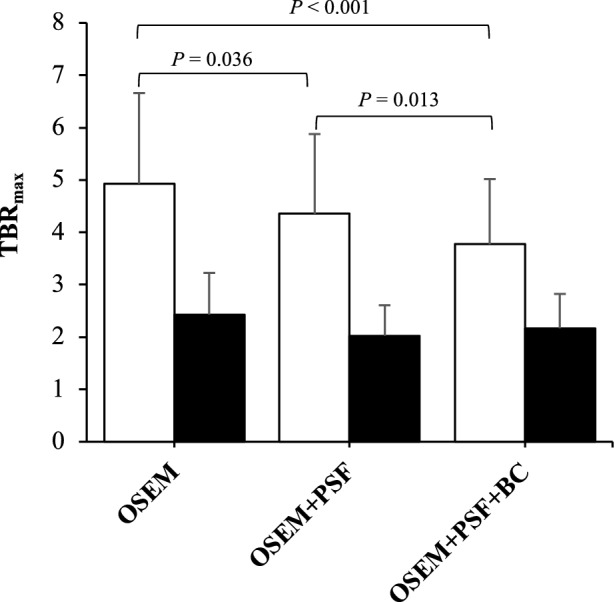
Evaluating the significance of uptake differences between the uncorrected and corrected images using paired t test. The plot displays the mean TBRmax. The error-bar represents the standard deviation (SD)

Evaluating the significance of uptake differences between the uncorrected and corrected images using paired t test. The plot displays the mean TBRmax. The error-bar represents the standard deviation (SD)