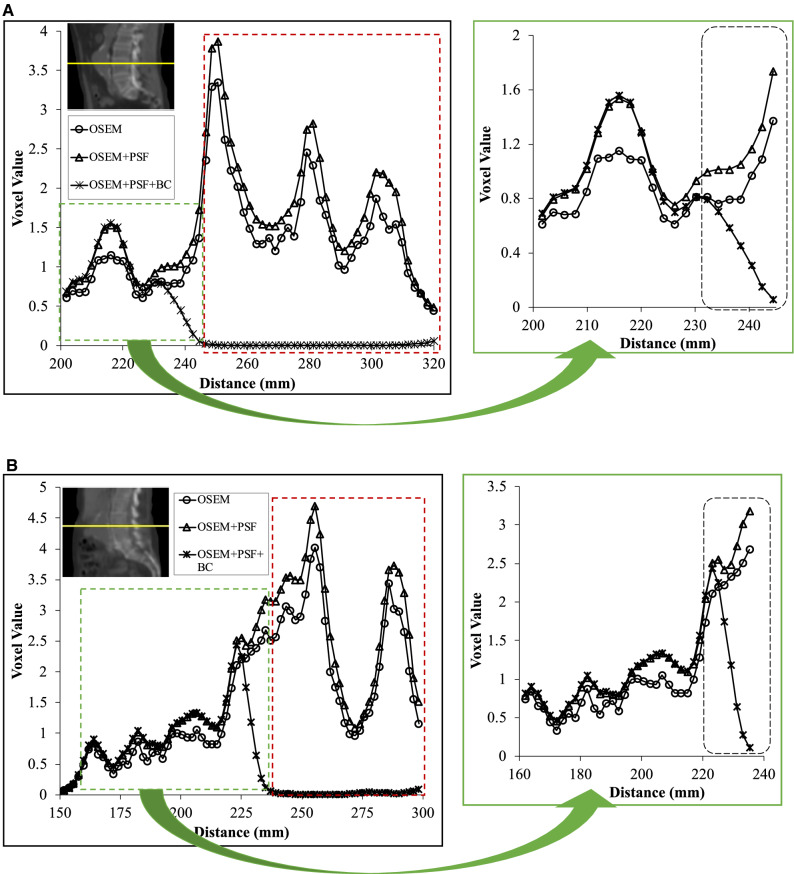
Figure 3.
Profile across the bone (red dashed rectangle) and the aneurysm (green dashed rectangle), when the aneurysm is (A) detached from the bone, and (B) in contact with the bone. The portion of the aneurysm prone to the spill in effects from the bone is highlighted by the black dashed rectangle. Note that for OSEM + PSF + BC, the bone activity has been removed

