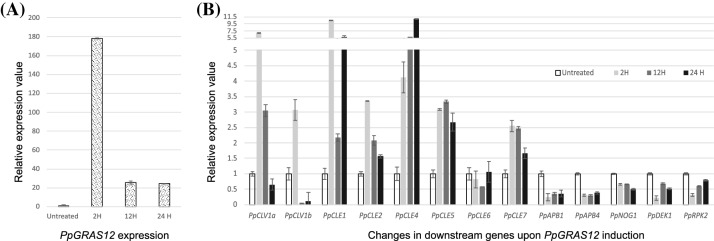
Fig. 5.
The relative expression levels of PpGRAS12 and other members of MAPK signaling pathway in the WT and PpGRAS12-iOE lines. a The relative expression levels of PpGRAS12 2 h, 12 h and 24 h after induction. b The relative expression levels of PpCLV1a, PpCLV1b, PpCLE1, PpCLE2, PpCLE4, PpCLE5, PpCLE6, PpCLE7, PpAPB1, PpAPB4, PpNOG1, PpDEK1 and PpRPK2 2 h, 12 h and 24 h after induction of the PpGRAS12 gene. Plants were grown on standard solid growth medium for 4 weeks, induced for 2 h, 12 h and 24 h and RNA from gametophore tissue was used for qRT-PCR. Relative gene expression levels were normalized to PpEf1a and PpC45 and transcription rates in the uninduced PpGRAS12-iOE line were set to 1. Error bars indicate mean values ± SE (3 biological replicates with three technical replicates each). Statistically significant differences for each gene were analyzed by one-way ANOVA (p < 0.05)

