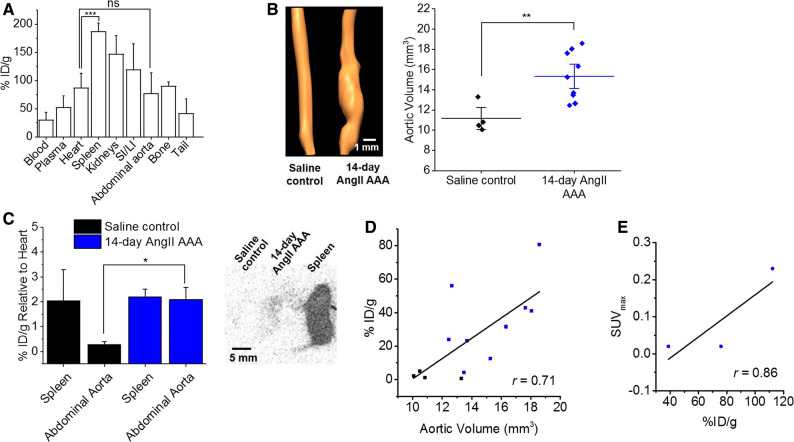
Figure 4.
Aortic volume and [18F]FLT uptake are positively correlated. (A) Decay-corrected ex vivo [18F]FLT counts per mass units in baseline control C57BL6 mice (n = 4). Comparisons are shown for positive (spleen) vs negative (heart) controls and tissue of interest (aorta) vs heart. ***P < 0.001, ns, not significant on one-way analysis of variance with post hoc Bonferroni-Holm correction. (B) Representative USS three-dimensional aortic lumen reconstructions and volumes in 14-day AngII AAA (n = 9) vs saline control aortae (n = 4). **P < 0.01 on two-sampled t test with Welch’s correction. (C) Decay-corrected ex vivo [18F]FLT counts per mass units in spleens and abdominal aortae relative to the hearts from AngII AAA (n = 3) and saline control (n = 3) mice, and example ex vivo [18F]FLT autoradiography image using the same tissues. *P < 0.05 on two-sampled t test with Welch’s correction. The spleen is included as reference. (D) Correlation between aortic volume and ex vivo [18F]FLT counts per mass units. Pearson’s r = 0.71, P < 0.01. (E) Correlation between SUVmax and ex vivo [18F]FLT counts per mass units. Pearson’s r = 0.86; black, saline control; blue, AngII AAA. USS, ultrasound scanning; AngII AAA, angiotensin II abdominal aortic aneurysm; [18F]FLT, [18F]fluorothymidine; SI/LI, small and large intestines; SUVmax, maximum standardized uptake value

