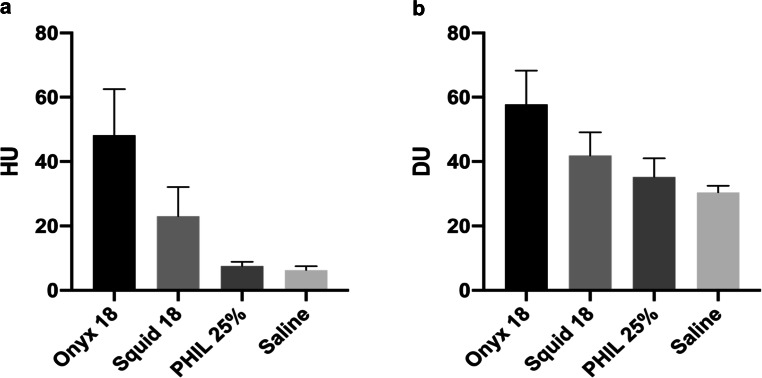
Fig. 3.
Illustration of the results of the quantitative image analysis. A different degree of artifacts was observed in the standardized ROI between all four study groups in conventional CT (a) and cone-beam CT (b). Kruskal-Wallis test showed significant differences between all groups, except for PHIL 25% vs. saline in conventional CT. For both imaging modalities Onyx 18 produced the highest degree of artifacts. Bars mean; whiskers standard deviation, HU Hounsfield units, DU density units

