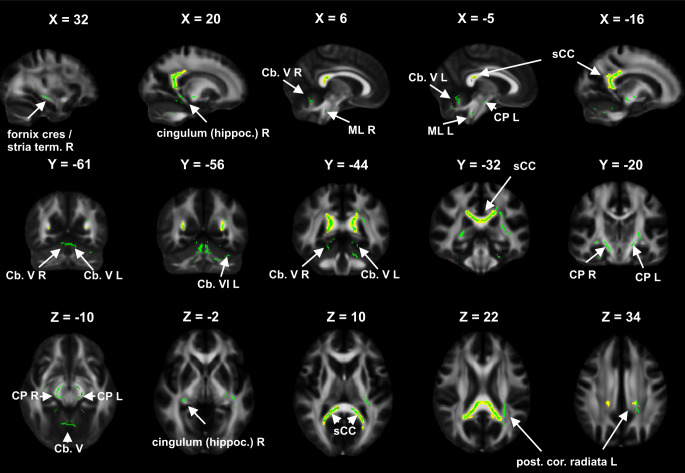
Fig. 2.
Differences between cognitively impaired patients (Ci_P) and cognitively preserved patients (Cp_P): the figure demonstrates a voxel-wise group comparison, whereby regions of interest with significant fractional anisotropy (FA) reduction (green overlay) or mean diffusivity (MD) increase (yellow overlay, dilated by 1.5 pixels to improve visibility) in Ci_P compared to Cp_P are shown in sagittal, coronal and axial views on an FA template map in MNI coordinates, X, Y, Z: slices positions in MNI coordinates. The presentation is based on the comparison of the patients and the different groups are not shown here. The green and yellow overlays highlight those clusters of significant differences between patients and healthy controls (based on the preceding tract based spatial statistics analysis [15]) in which stronger involvement was detected in the Ci_P subgroup. FA reduction and MD increase is visible in the splenium of CC. Additional FA reduction is shown in the left hippocampal cingulum, fornix (cres.)/stria terminalis and posterior corona radiata, bihemispheric cerebral peduncle and medial lemnisculus, and in cerebellar lobules V and VI. L left hemisphere, R right hemisphere, sCC splenium of corpus callosum, post. cor. radiata posterior corona radiata, CP cerebral peduncle, Cb cerebellum, cingulum (hippoc.) hippocampal cingulum, fornix (cres.)/stria term. fornix (cres.)/stria terminalis, ML medial lemniscus

