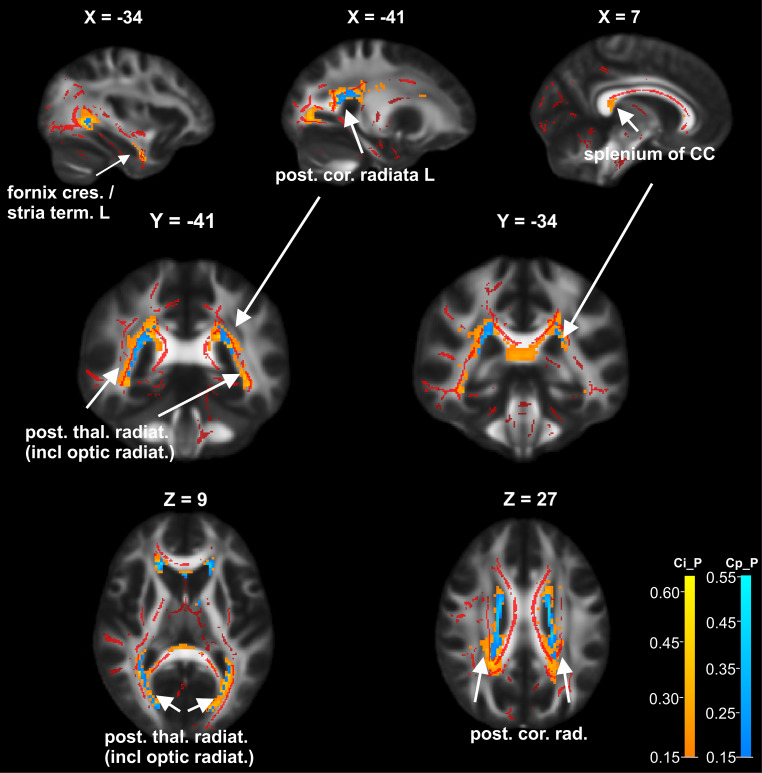
Fig. 3.
Lesion probability in cognitively impaired patients (Ci_P) and cognitively preserved patients (Cp_P): lesion probability maps of Ci_P (orange/yellow overlay) and Cp_P (light blue overlay) subgroups, and FA clusters of significant differences between patients and healthy controls (red overlay, based on the preceding TBSS analysis [15]) are shown in sagittal, coronal and axial views on an FA template map in MNI coordinates, X, Y, Z: slices positions in MNI coordinates. The lesion probability maps were thresholded at 0.15, thus voxels in which at least 15% of patients had FLAIR lesions are displayed. Areas of high lesion probability which were detected bilaterally in the posterior corona radiata and posterior thalamic radiation were found in both, Ci_P and in Cp_P, with larger involvement in Ci_P. Exclusive lesion load detected in the Ci_P group is depicted in the splenium of the corpus callosum and the bilateral fornix (cres)/stria terminalis, respectively temporal WM. L left hemisphere, R right hemisphere, post. cor. rad. posterior corona radiata, ant. cor. rad. anterior corona radiata, sup. cor. rad. superior corona radiata, post. thal. radiat. (incl. optic radiat.) posterior thalamic radiation (including optic radiation), fornix (cres.)/stria term. fornix (cres)/stria terminalis

