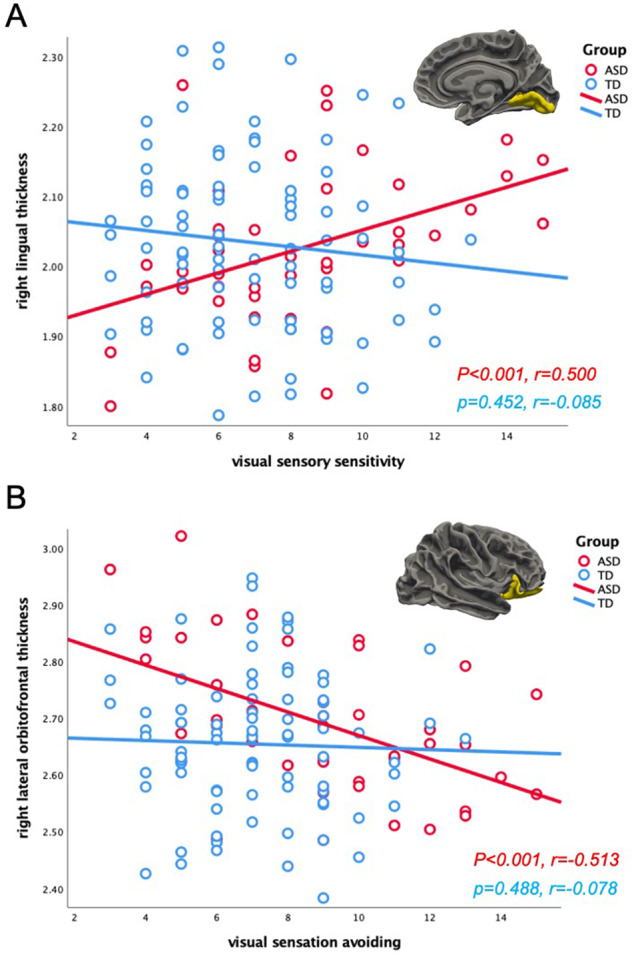
Fig. 2. Relationship between AASP scores and cortical thickness.

A Significant correlation between visual sensory sensitivity scores on the AASP and the right lingual cortical thickness in the ASD group (TD: p = 0.452, r = 0.085; ASD: p < 0.001, r = 0.500). The group differences of correlations between the two groups (z = 3.28, p = 0.001). B Significant correlation between visual sensation avoiding scores on the AASP and the right lateral orbitofrontal cortical thickness in the ASD group (TD: p = 0.488, r = −0.078; ASD: p < 0.001, r = −0.513). The group differences of correlations between the two groups (z = 2.57, p = 0.011). AASP Adolescent/Adult Sensory Profile, ASD autism spectrum disorder, TD typically developing.
