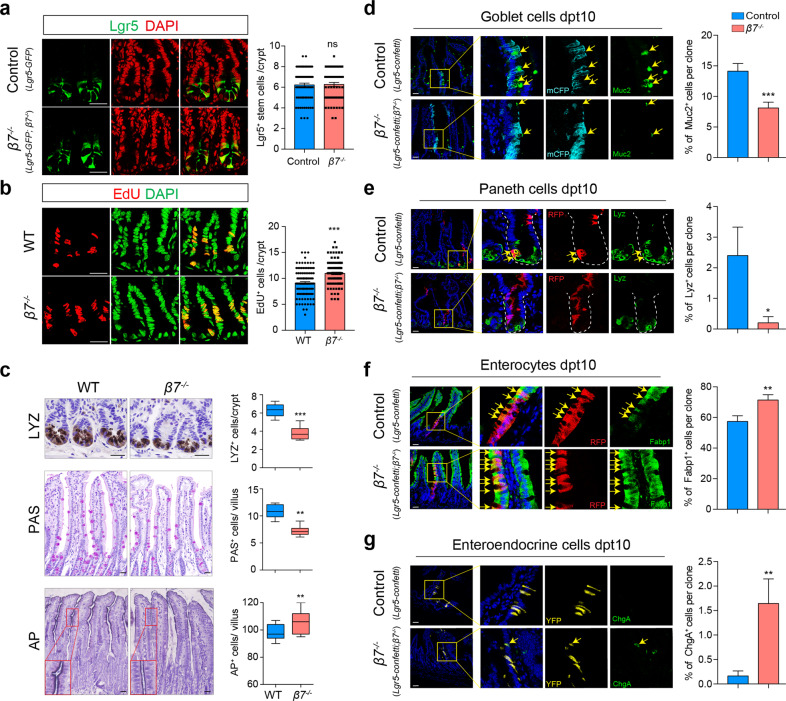
Fig. 2. Intestinal lymphocyte deficiency led to aberrant ISC proliferation and differentiation.
a Representative images (left) and quantification (right) of Lgr5+ ISCs per crypt section in control (Lgr5-GFP) and β7−/− (Lgr5-GFP; β7−/−) mice. The sections were counterstained with DAPI (red). Scale bars, 50 μm. n = 72 crypts from three WT mice and n = 60 crypts from three β7−/− mice. Data are represented as means ± SEM, ns, no significant difference, t-test. b Representative images (left) and quantification (right) of EdU+ (red) cells in the crypts of WT and β7−/− mice. The sections were counterstained with DAPI (green). Scale bars, 50 μm. n = 104 crypts from three WT mice and n = 100 crypts from three β7−/− mice. Data are represented as means ± SEM. ***P < 0.001, t-test. c Immunohistochemical analysis of paraffin-embedded small intestinal sections from WT and β7−/− mice. Paneth cells (top), goblet cells (middle) and enterocytes (bottom) were visualized by LYZ staining, PAS staining and AP staining, respectively (left panel). Scale bars, 50 μm. Quantification of LYZ+ Paneth cells, PAS+ goblet cells and AP+ enterocytes in each crypt or villus (right panel). n = 6 mice per group, more than 8 fields per mouse. Data are represented as means ± SEM, ***P < 0.001, **P < 0.01, t-test. d–g Multi-lineage tracing in control (Lgr5-Confetti) and β7−/− (Lgr5-Confetti; β7−/−) mice 10 days after one dose TAM treatment. The Lgr5-Confetti mice showed polyclonal crypts and villi by activating one of the Confetti colors (membranous CFP, cytoplastic YFP and RFP, nuclear GFP) in individual Lgr5+ ISCs. Differentiation markers were detected by immunofluorescence within Lgr5 lineage stripes, with Muc2 for goblet cells (d), LYZ for Paneth cells (e), Fabp1 for enterocytes (f) and ChgA for enteroendocrine cells (EECs) (g). Left, representative images of one Confetti color lineage for each differentiated cell type. Yellow arrows identify cells co-expressing the Confetti color and the marker of the indicated cell types. Scale bars, 50 μm. Right, percentage of the differentiated cell types in each clone. More than 100 clones were analyzed for each cell type. Data are represented as means ± SEM, ***P < 0.001, **P < 0.01, *P < 0.05, t-test.

