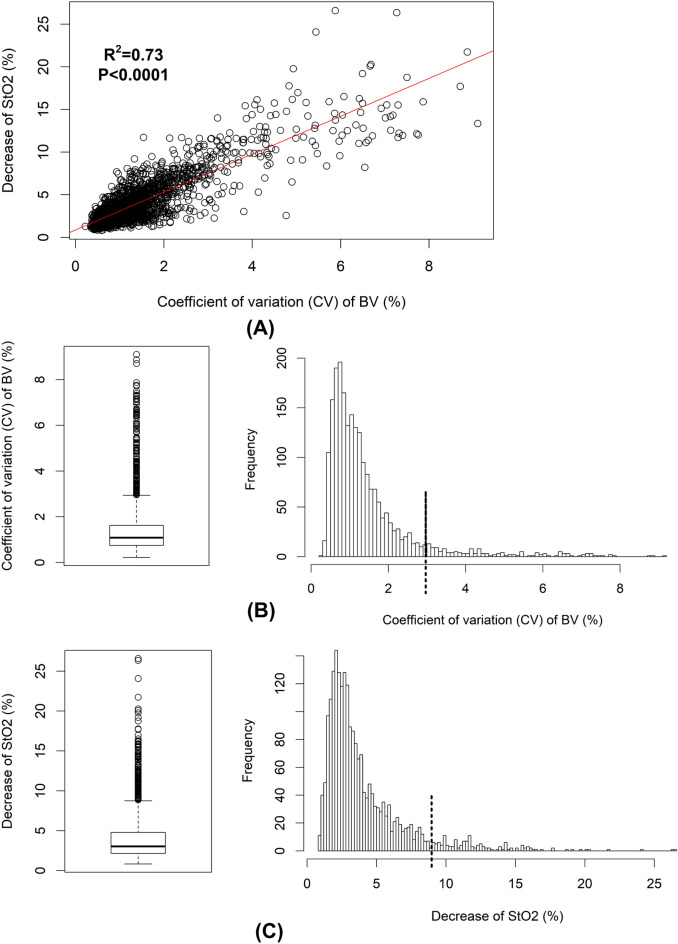
Figure 3.
The distributions of the coefficient of variation (CV) of cerebral blood volume (BV) and the decrease of cerebral StO2 (de-StO2). Changes in CV of BV and de-StO2 are correlated as shown in (A). The box plot suggests the outliers of CV of BV are larger than 3% and the cut-off 3% is marked with the dash line in its distribution (B). Similarly, the cut-off for outliers is 8.7% as shown in the box plot of de-StO2 and it is marked with the dash line in the distribution (C).

