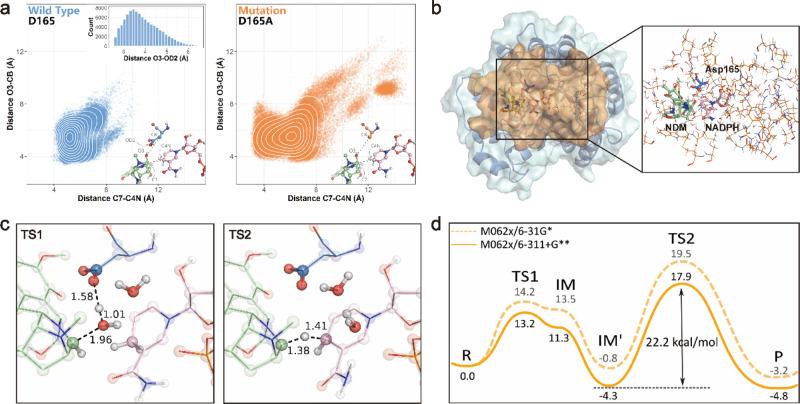
Fig. 4. The MD simulations and QM/MM calculations for NapW/NADPH-NDM model.
a The two-dimensional scatter plot of distance C7-C4N and O3-CB. The wild-type system was shown in blue and the mutation system was shown in orange. In each model subplot, the structure of active site including NDM (green), NADPH (pink), and residue 165 (blue or orange) was shown in the bottom right. The important atoms and distances were annotated in gray. The distance O3-OD2 was counted and shown in the wild in the upper right in the wild-type system subplot. b The computational model for QM/MM calculations. The protein NapW was shown in blue while the orange part was represented the computational model. The QM region was shown in the form of a ball and stick model on the right. The part shown in the line form was set in MM region. c The optimized structures of key transition states (TSs). The key distances related to the catalytic reaction of NapW were labeled. d The reaction energy profile for NapW/NADPH-NDM model.

