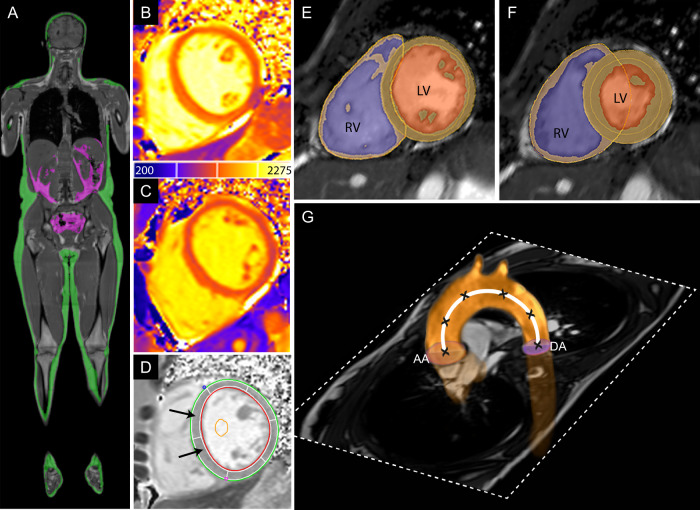
Fig. 2. Magnetic resonance images demonstrating the assessment of cardiac function and mass, native T1, pulse-wave velocity, and whole-body fat.
A Whole body fat. Visceral (green) and subcutaneous (purple) adipose tissue segmentations shown on coronal reformat of whole-body fat image. B–D Native T1. Representative native T1 map for healthy control (B) and a patient with chronic schizophrenia (C). Each slice was semi-automatically segmented with endocardial (red) and epicardial (green) borders and divided into six segments (D). Native myocardial T1 time was calculated as the mean T1 time the two septal segments (black arrows). E, F Ventricular function and mass. Endocardial and epicardial contours of the left and right ventricle in diastole (E) and systole (F). Segmentation shows myocardium (orange), left ventricular (LV) cavity (dark orange), and right ventricular (RV) cavity (purple). G Pulse-wave velocity. Transverse cardiac magnetic resonance imaging slice through the aortic arch displaying the magnitude (dotted white slice) with velocity encoded flow through the ascending aorta (AA) and descending aorta (DA). Path length was determined by markers (X) creating a three-dimensional Bezier curve (white line) through the centre of the aorta that intersected the plane at which flow measurements were acquired.

