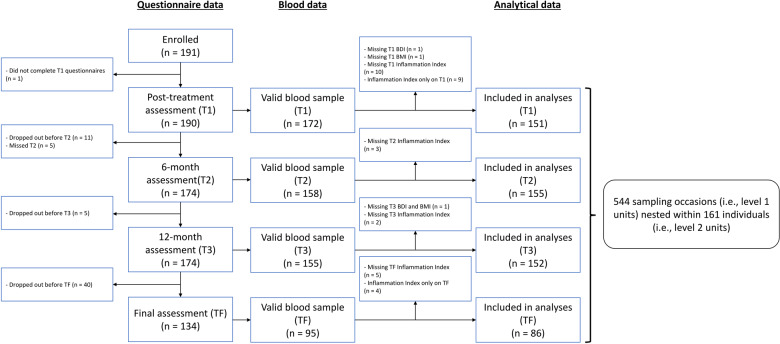
Fig. 1. Study flow chart. A total of 161 participant contributed 544 (151 + 155 + 152 + 86) sampling occasions across the full study period.
It should be noted that some participants contributed valid level 1 observations at some time points but not others, and were still in analyses if they contributed at least 2 valid sampling occasions (e.g., missing T1 inflammation and depression data but valid data at T2 and T3). For this reason, the total number of level 2 units (161 participants) is greater than the total number of level 1 units (sampling occasions) at any given time point of the study (151, 155, 152, and 86).

