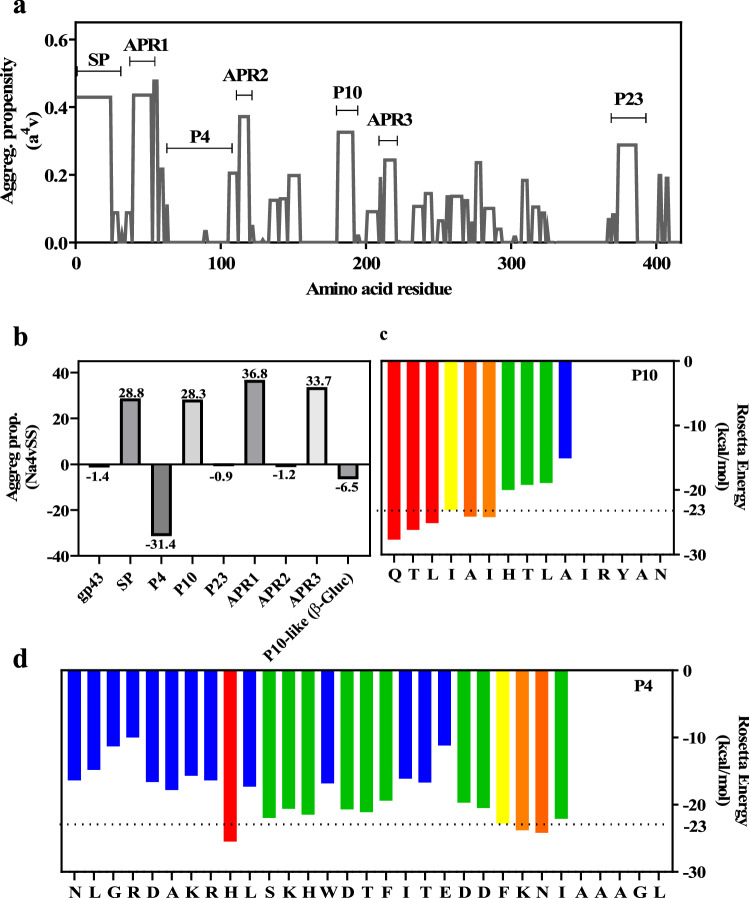
Figure 2.
Aggregation propensity analysis of entire gp43 and its derived peptides. (a) Aggrescan analysis of entire gp43 showing its aggregation propensity scores as a function of its primary sequence. SP: signal peptide (amino acids 1–35); APR1, 2 and 3: amyloid-prone regions 1, 2 and 3. Regions corresponding to P4, P10 and P23 are marked. (b) Aggrescan analysis of different segments of gp43 (SP, APR, P4, P10 and P23) as well as the corresponding sequence of P10 in β-glucanase from P. lutzii (QTLAAIRALANRYAK). (c and d) ZipperDB analysis of P10 and P4, respectively, showing the hexapeptides predicted to form steric zippers (Rosetta energy values bellow − 23 kcal/mol). Yellow, orange and red bars indicate the first residue of a hit hexapeptide (N to C terminal); green and blue bars indicate that the hexapeptide beginning at that residue does not fit into a steric zipper.

