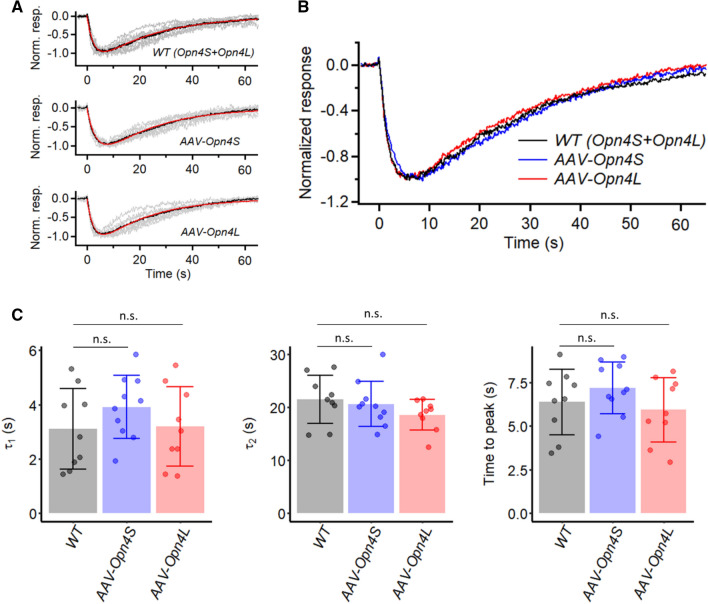
Figure 2.
Kinetics of intrinsic dim-flash responses from Opn4−/− M1-ipRGCs expressing virally-delivered Opn4S (AAV-Opn4S) or Opn4L (AAV-Opn4L), and from WT M1-ipRGCs which endogenously express both isoforms. All cells were stimulated via a light spot of 40-μm diameter centered on soma. (A) The averaged dim-flash responses (grey traces, 5–15 pA) recorded from nine WT M1-ipRGCs (top), ten AAV-Opn4S M1-ipRGCs (middle), and nine AAV-Opn4L M1-ipRGCs (bottom) are normalized in peak amplitude and superimposed. Averaged responses (black traces) are fit to the convolution of two single-exponential declines (red traces), . WT: τ1 = 2.7 s, τ2 = 22.9 s. AAV-Opn4S: τ1 = 3.6 s, τ2 = 21.0 s. AAV-Opn4L: τ1 = 2.7 s, τ2 = 20.1 s. (B) Black traces in (A) superimposed for comparison. (C) Collected data on τ1 and τ2 and time-to-peak from individual cells of each genotype. Bars and error bars represent mean ± SD. (n.s., not statistically significant).

