Figure 4.
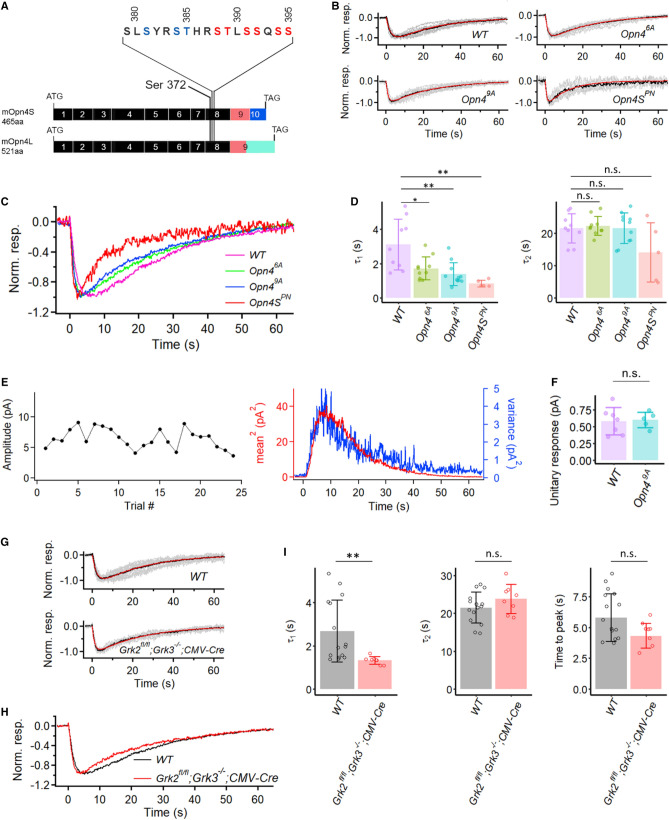
Intrinsic light responses from M1-ipRGCs expressing different phosphorylation-mutant melanopsins (Opn46A, Opn49A, Opn4SPN) and also from conditional GRK2, GRK3 double knock-out M1-ipRGCs. (A) Generation of Opn46A and Opn49A mice. The codon for Ser372, the most proximal potential phosphorylation site on the C-terminus of melanopsin, is located on exon 8. The six “critical phosphorylation sites” proposed by Blasic et al.34 are marked in red. Three additional residues proposed by Mure et al.35 are marked in blue. Note that these proposed “critical residues” are shared by both OPN4S and OPN4L. (B) Grand-averaged dim-flash response (black trace in each panel) from nine WT, ten Opn46A, eleven Opn49A, and five Opn4SPN M1-ipRGCs. All cells were stimulated via a light spot of 40-μm diameter centered on soma. Superimposed grey traces in each panel show normalized and averaged responses from individual cells. The red trace in each panel shows the fit to the black trace by the convolution of two single-exponential decays, , with τ1 = 2.7 s and τ2 = 22.9 s for WT, τ1 = 1.6 s and τ2 = 22.9 s for Opn46A cells, τ1 = 1.2 s and τ2 = 22.8 s for Opn49A cells, and τ1 = 0.81 s and τ2 = 11.5 s for Opn4SPN cells. (C) Superposition of black traces in (B) for comparison of response waveforms in WT, Opn46A, Opn49A, and Opn4SPN cells. (D) Collected data on τ1 and τ2 from individual cells of each genotype. Bars and error bars represent mean ± SD. WT: τ1 = 3.1 ± 1.5 s and τ2 = 21.5 ± 4.6 s. Opn46A: τ1 = 1.7 ± 0.7 s and τ2 = 22.2 ± 2.9 s. Opn49A: τ1 = 1.4 ± 0.7 s and τ2 = 21.5 ± 4.7 s. Opn4SPN: τ1 = 0.84 ± 0.20 s and τ2 = 14.0 ± 9.1 s. Adjusted p-values for pairwise comparisons in τ1 with the Benjamini–Hochberg procedure are 0.026 for WT vs. Opn46A, 0.0053 for WT vs. Opn49A, 0.0053 for WT vs. Opn4SPN. For comparisons in τ2: p = 0.28, Kruskal–Wallis test. (**, p < 0.01; *, p < 0.05; n.s., not statistically significant.) (E) Extraction of unitary response amplitude from an Opn49A M1-ipRGC. Left: Stationarity of the dim-flash response over time. Right: Similar waveforms shown by the square of the ensemble mean of a series of responses to identical dim flashes and the ensemble variance of the dim-flash responses. (F) Comparison between the unitary-response amplitudes from WT and Opn49A M1-ipRGCs. Bars and error bars represent mean ± SD. (G) Grand average (black trace) of normalized mean dim-flash responses (grey traces, 5–15 pA) from fifteen WT (top panel) and eight CMV-Cre;Grk2fl/fl;Grk3−/− M1-ipRGCs (bottom panel). In each panel, the red trace is the fit by the convolution of two single-exponential declines, . WT: τ1 = 2.2 s and τ2 = 23.3 s. CMV-Cre;Grk2fl/fl;Grk3−/−: τ1 = 1.3 s and τ2 = 23.8 s. (H) Superposition of grand-averaged dim-flash responses from WT and CMV-Cre;Grk2fl/fl;Grk3−/− M1-ipRGCs (the two black traces in G) for comparison of the response waveforms. (I) Collected data for τ1, τ2 and time-to-peak from (G). τ1: 2.7 ± 1.4 s for WT and 1.3 ± 0.2 s for CMV-Cre;Grk2fl/fl;Grk3−/− (p = 2.7 × 10⁻⁴, Wilcox test). τ2: 21.5 ± 4.1 s for WT and 23.8 ± 3.8 s for CMV-Cre;Grk2fl/fl;Grk3−/− (p = 0.29, Wilcox test). Time-to-peak: 6.0 ± 1.9 s for WT and 4.6 ± 1.0 s for CMV-Cre;Grk2fl/fl;Grk3−/− (p = 0.19, Wilcox test). (**, p < 0.01; n.s., not statistically significant).

