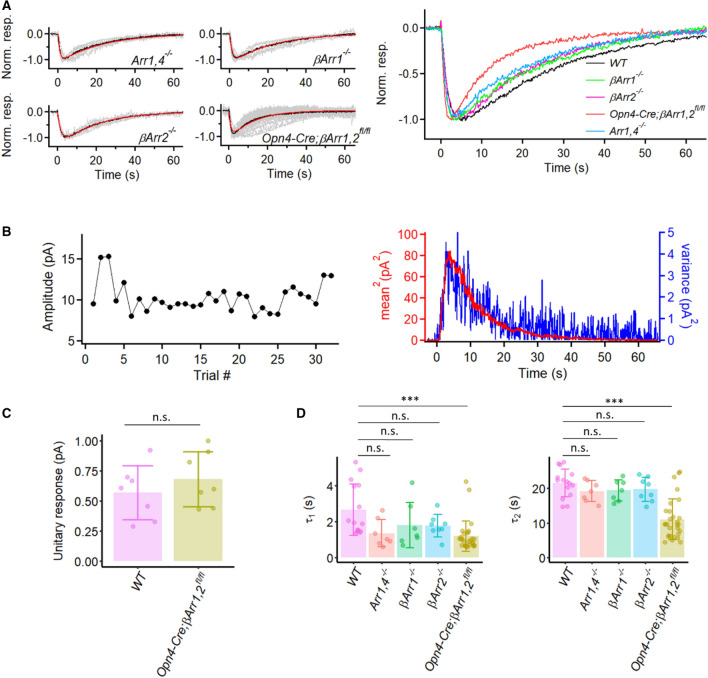
Figure 5.
Kinetics of intrinsic dim-flash responses from various arrestin knock-out M1-ipRGCs. (A) Left: Grand average (black trace) of normalized mean dim-flash responses (grey traces, 5–15 pA) from seven Arr1,4−/− M1-ipRGCs, seven βArr1−/− M1-ipRGCs, eight βArr2−/− M1-ipRGCs, and twenty-nine Opn4-Cre;βArr1,2fl/fl M1-ipRGCs. In each panel, the red trace is the fit to the black trace by the convolution of two single-exponential declines, . Arr1,4−/−: τ1 = 1.0 s, τ2 = 22.3 s. βArr1−/−: τ1 = 1.5 s, τ2 = 21.1 s. βArr2−/−: τ1 = 2.0 s, τ2 = 18.9 s. Opn4-Cre;βArr1,2fl/fl: τ1 = 1.1 s, τ2 = 12.5 s. Right: Superposition of grand-averaged dim-flash responses from Arr1,4−/−, βArr1−/−, βArr2−/−, Opn4-Cre;βArr1,2fl/fl M1-ipRGCs (the black traces in Left panel), as well as WT M1-ipRGCs for comparison of the response waveforms. (B) Extraction of unitary response amplitude from an Opn4-Cre;βArr1,2fl/fl M1-ipRGC. Left: Stationarity of the dim-flash response over time. Right: Similar waveforms shown by the square of the ensemble mean of a series of responses to identical dim flashes and the ensemble variance of the dim-flash responses. Unitary response = 0.43 pA. (C) Comparison between the unitary-response amplitudes from WT and Opn4-Cre;βArr1,2fl/fl M1-ipRGCs. Bars and error bars represent mean ± SD. WT: 0.57 ± 0.22 pA (n = 7). Opn4-Cre;βArr1,2fl/fl: 0.68 ± 0.23 pA (n = 7). p = 0.62, Wilcoxon test. (n.s., not statistically significant.) (D) Collected data on τ1 and τ2 from individual cells of each genotype. Bars and error bars represent mean ± SD. WT: τ1 = 2.7 ± 1.4 s and τ2 = 21.5 ± 4.1 s. Arr1,4−/−: τ1 = 1.4 ± 0.8 and τ2 = 19.2 ± 3.0 s. βArr1−/−: τ1 = 1.8 ± 1.3 s and τ2 = 19.4 ± 3.1 s. βArr2−/−: τ1 = 1.8 ± 0.6 s and τ2 = 19.7 ± 3.4 s. Opn4-Cre;βArr1,2fl/fl: τ1 = 1.2 ± 0.8 s and τ2 = 11.0 ± 5.9 s. Adjusted p-values for pairwise comparisons in τ1 using Benjamini–Hochberg procedure are 0.06 for WT vs. Arr1,4−/−, 0.18 for WT vs. βArr1−/−, 0.56 for WT vs. βArr2−/−, 1.0 × 10⁻⁴ for WT vs. Opn4-Cre;βArr1,2fl/fl. Adjusted p-values for pairwise comparisons in τ2 using Benjamini–Hochberg procedure are 0.44 for WT vs. Arr1,4−/−, 0.44 for WT vs. βArr1−/−, 0.46 for WT vs. βArr2−/−, 1.6 × 10⁻⁴ for WT vs. Opn4-Cre;βArr1,2fl/fl. (***, p < 0.001; n.s., not statistically significant).

