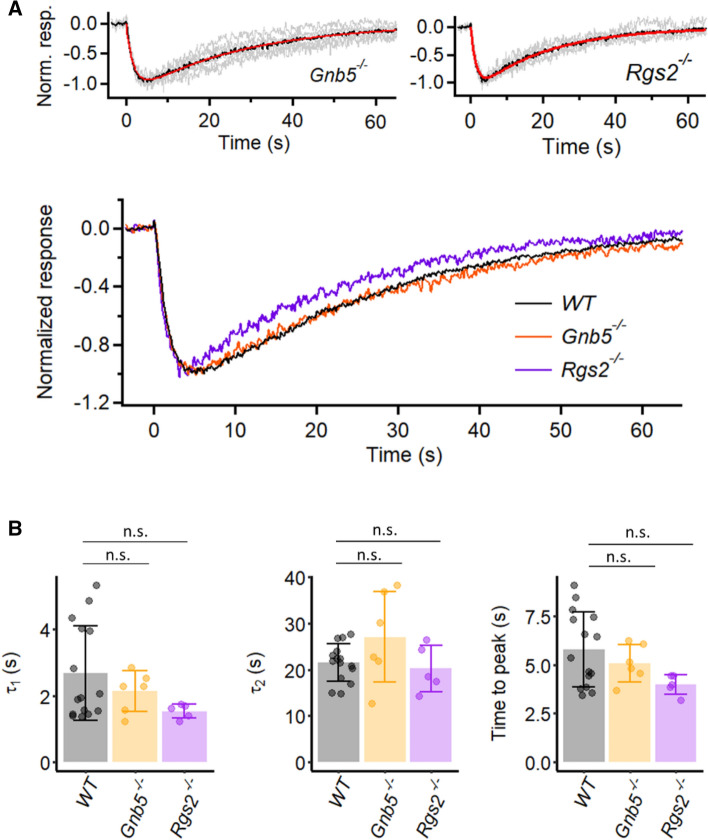
Figure 6.
Kinetics of intrinsic dim-flash responses from Gnb5−/− M1-ipRGCs and Rgs2−/− M1-ipRGCs. (A) Top: Grand average (black trace) of normalized mean dim-flash responses (grey traces, 3–15 pA) from six Gnb5−/− M1-ipRGCs and four Rgs2−/− M1-ipRGCs. In each panel, the red trace is the fit to the black trace by the convolution of two single-exponential declines, . Gnb5−/−: τ1 = 1.87 s, τ2 = 26.8 s. Rgs2−/−: τ1 = 1.51 s, τ2 = 20.0 s. Bottom: Superposition of grand-averaged dim-flash responses from WT (same trace in Fig. 2B), Gnb5−/− and Rgs2−/− M1-ipRGCs (the black traces in Top) for comparison of the response waveforms. (B) Collected data on τ1 and τ2 and time-to-peak from individual cells of each genotype. Bars and error bars represent mean ± SD. τ1: 2.1 ± 0.6 s for Gnb5−/−, 1.5 ± 0.2 s for Rgs2−/−, and 2.7 ± 1.4 s for WT (p = 0.25, Kruskal–Wallis test). τ2: 27.1 ± 9.9 s for Gnb5−/−, 20.2 ± 5.0 s for Rgs2−/−, and 21.5 ± 4.1 s for WT (p = 0.34, Kruskal–Wallis test). Time to peak: 5.3 ± 1.0 s for Gnb5−/−, 4.2 ± 0.5 s for Rgs2−/−, and 6.0 ± 1.9 s for WT (p = 0.09, Kruskal–Wallis test). (n.s., not statistically significant).

