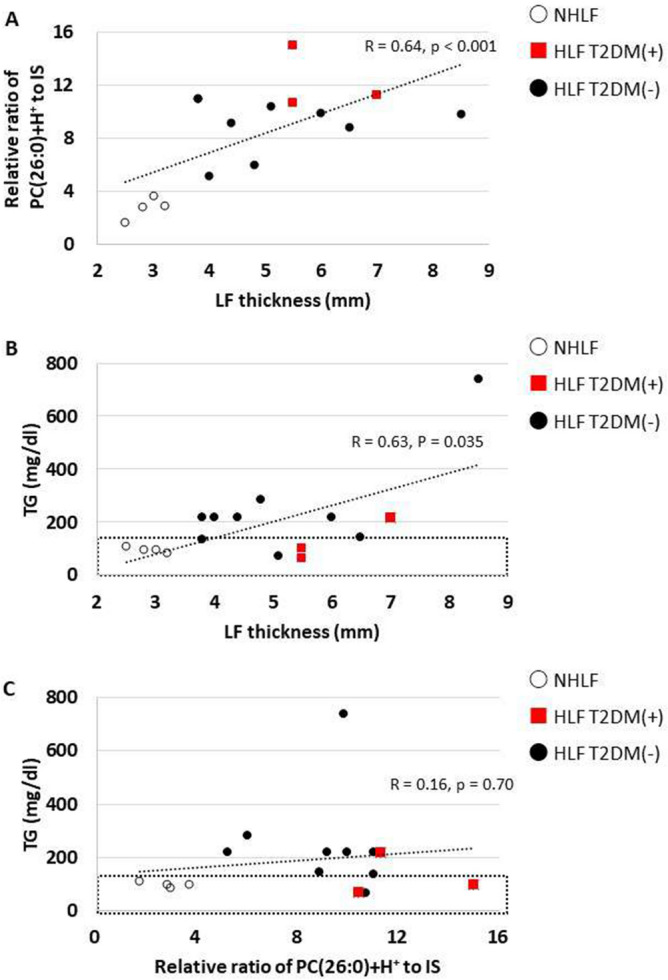
Figure. 7.

Dot plots of data from patients with non-hypertrophied ligamentum flavum (NHLF) or hypertrophied ligamentum flavum (HLF) with type 2 diabetes mellitus (T2DM +), and HLF without T2DM( −). (A) Correlation between thickness of ligamentum flavum (LF) and the relative ratio of PC(26:0)+H+ to the internal standard (IS). (B) Correlation between thickness of LF and the concentration of serum triglyceride (TG) concentration. The black dotted rectangle represents the normal range of serum TG concentrations. (C) Correlation between the relative ratio of PC(26:0)+H+ to the IS and serum TG concentration. The black dotted rectangle represents the normal range of serum TG concentration.
