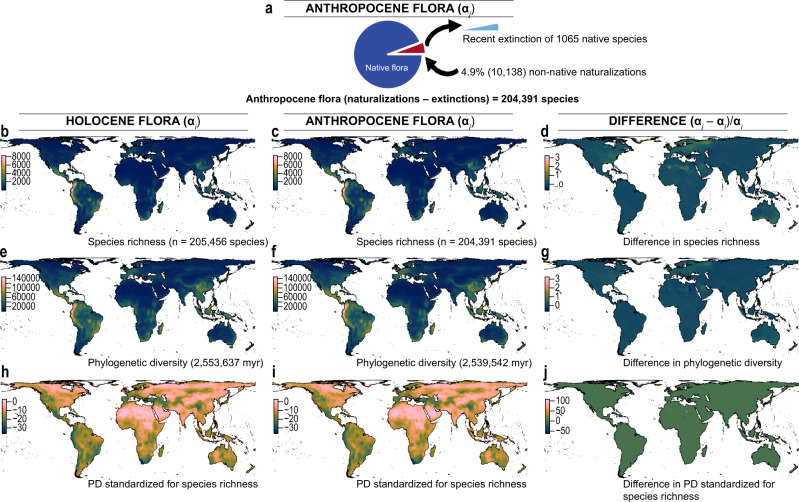
Fig. 1. Temporal and spatial changes in α-diversity across plant communities in the Anthropocene based on recent plant extinctions and naturalizations (best case scenario).
Left panel shows the Holocene flora, middle the Anthropocene flora (based on recent extinctions and naturalizations) and right panel differences between Holocene and Anthropocene floras. a Schematic of the Anthropocene flora showing recent extinctions replaced by non-native naturalizations. b–d Spatial and temporal changes in species (α) diversity. e–g Spatial and temporal changes in observed phylogenetic (α) diversity. h–j Spatial and temporal changes in phylogenetic (α) diversity standardized for species richness (phylogenetic tip shuffling 1000 times). Species diversity was calculated as the numbers of species within 100 km × 100 km grid cells (see Supplementary Fig. 1 for a different spatial scale). Phylogenetic diversity (PD) was calculated in million years (myr) as the sum of all phylogenetic branch lengths for the set of species within each grid cell. Species richness was corrected for by calculating the standardized effective size of phylogenetic (α) diversity based on 1000 randomizations (see Methods). Maps are in Behrmann equal-area projection.

