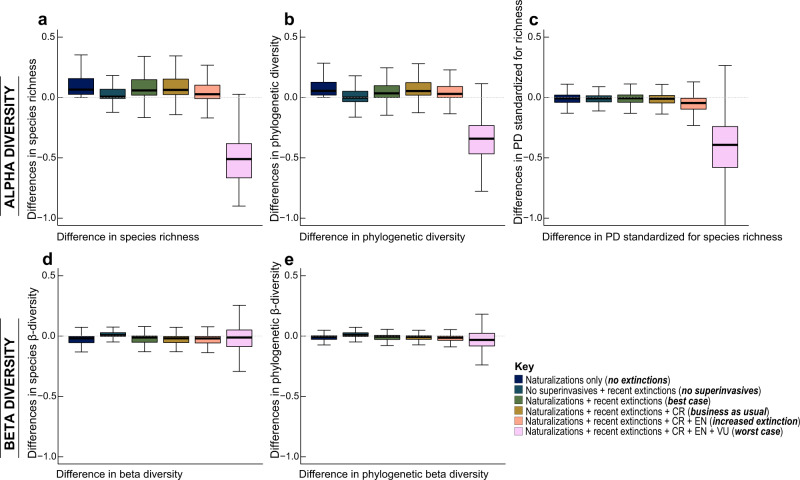
Fig. 3. Changes in plant communities under various scenarios of extinctions and naturalizations in the Anthropocene.
Top row a (n = 13,218 grid cells), b (n = 13,218 grid cells), and c (n = 13,218 grid cells) shows the differences in α-diversity and bottom row d (n = 13,218 grid cells), and e (n = 13,218 grid cells), shows differences in β-diversity. Comparisons are made across six scenarios: i) ‘no extinctions’ recent naturalizations only, ii) ‘no superinvasives’ based on the removal of non-native species with unusually large invaded ranges, iii) ‘Best case’ (based on recent extinctions and naturalizations that have occurred to date), iv) ‘business as usual’ projected extinction of critically endangered species (CR), v) ‘increased extinction’ based on projected extinction of endangered (EN) and CR species, and vi) ‘worst case’ based on projected extinction of all threatened species including vulnerable (VU), EN and CR species. Dashed line at zero corresponds to no change. Species richness was calculated as the numbers of species within 100 km × 100 km grid cells. Phylogenetic diversity was calculated as the sum of all phylogenetic branch lengths for the set of species within each grid cell. The bottom and top of boxes show the first and third quartiles respectively, the median is indicated by the horizontal line, the range of the data by the whiskers. The dataset used for the analysis included 205,456 native species, 1065 recently extinct species, extinction projections for 150,000 species, and 10,138 naturalized species. Source data are provided as a Source Data file.

