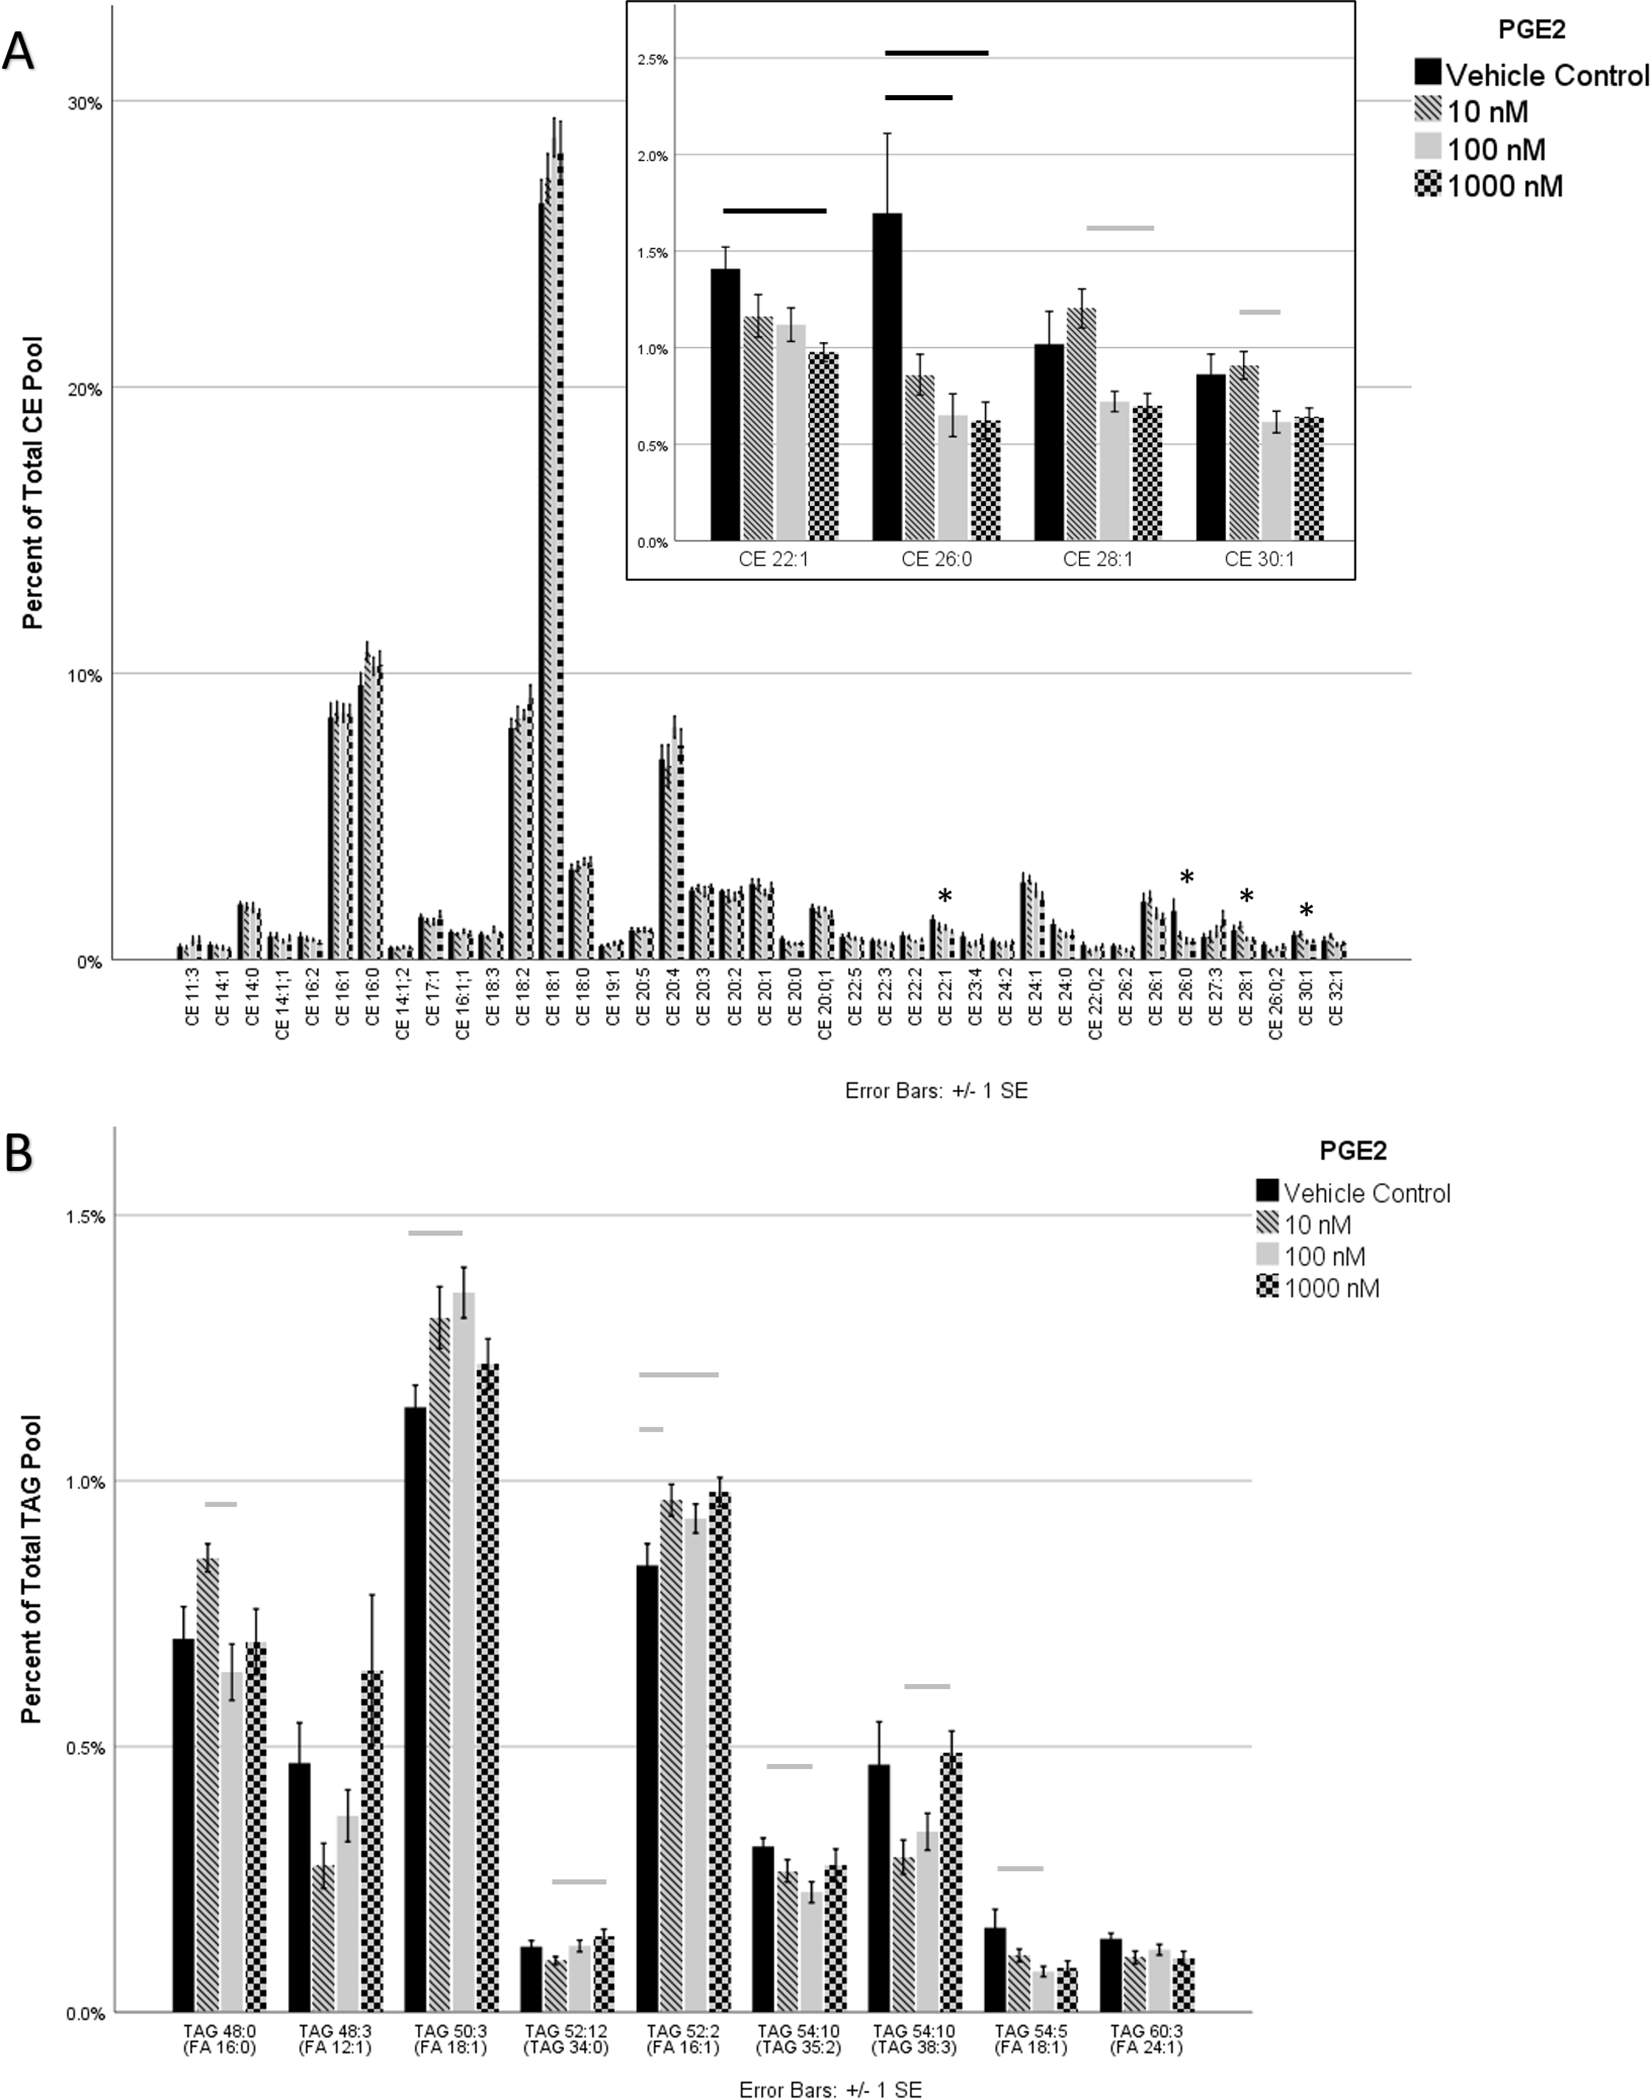
Figure 5:

HMGECs were differentiated for two days (see Methods) prior to exposure to PGE2 for three hours. Lipid extracts were analyzed by mass spectrometry. (A) Thirty-nine CEs met the criteria for analysis. Four of the 39 varied significantly with PGE2 supplementation (inset), and all were reduced with increased PGE2 concentrations. CEs are labeled by carbon number and double-bond count, respectively. When a third number is present, it denotes an oxCE with the corresponding number of oxygenations. (B) One hundred forty-five TAGs met the criteria for analysis. To aid legibility, only the nine that varied significantly with PGE2 are displayed. Two of the 9 failed to reach significance in pairwise comparisons. PGE2 promoted generalized TAG remodeling. TAGs are labeled by two numbers corresponding to the total number of carbons and the total number of double bonds, respectively. The fatty acid in parentheses represents one of the three fatty acids of the parent TAG molecule.
n = 4 per condition
* denotes significance
gray bar p ≤ 0.05, black bar p ≤ 0.01, dashed bar p ≤ 0.001
HMGEC: human meibomian gland epithelial cell
CE: cholesteryl ester
oxCE: oxidized cholesteryl ester
TAG: triacylglycerol
FA: fatty acid
