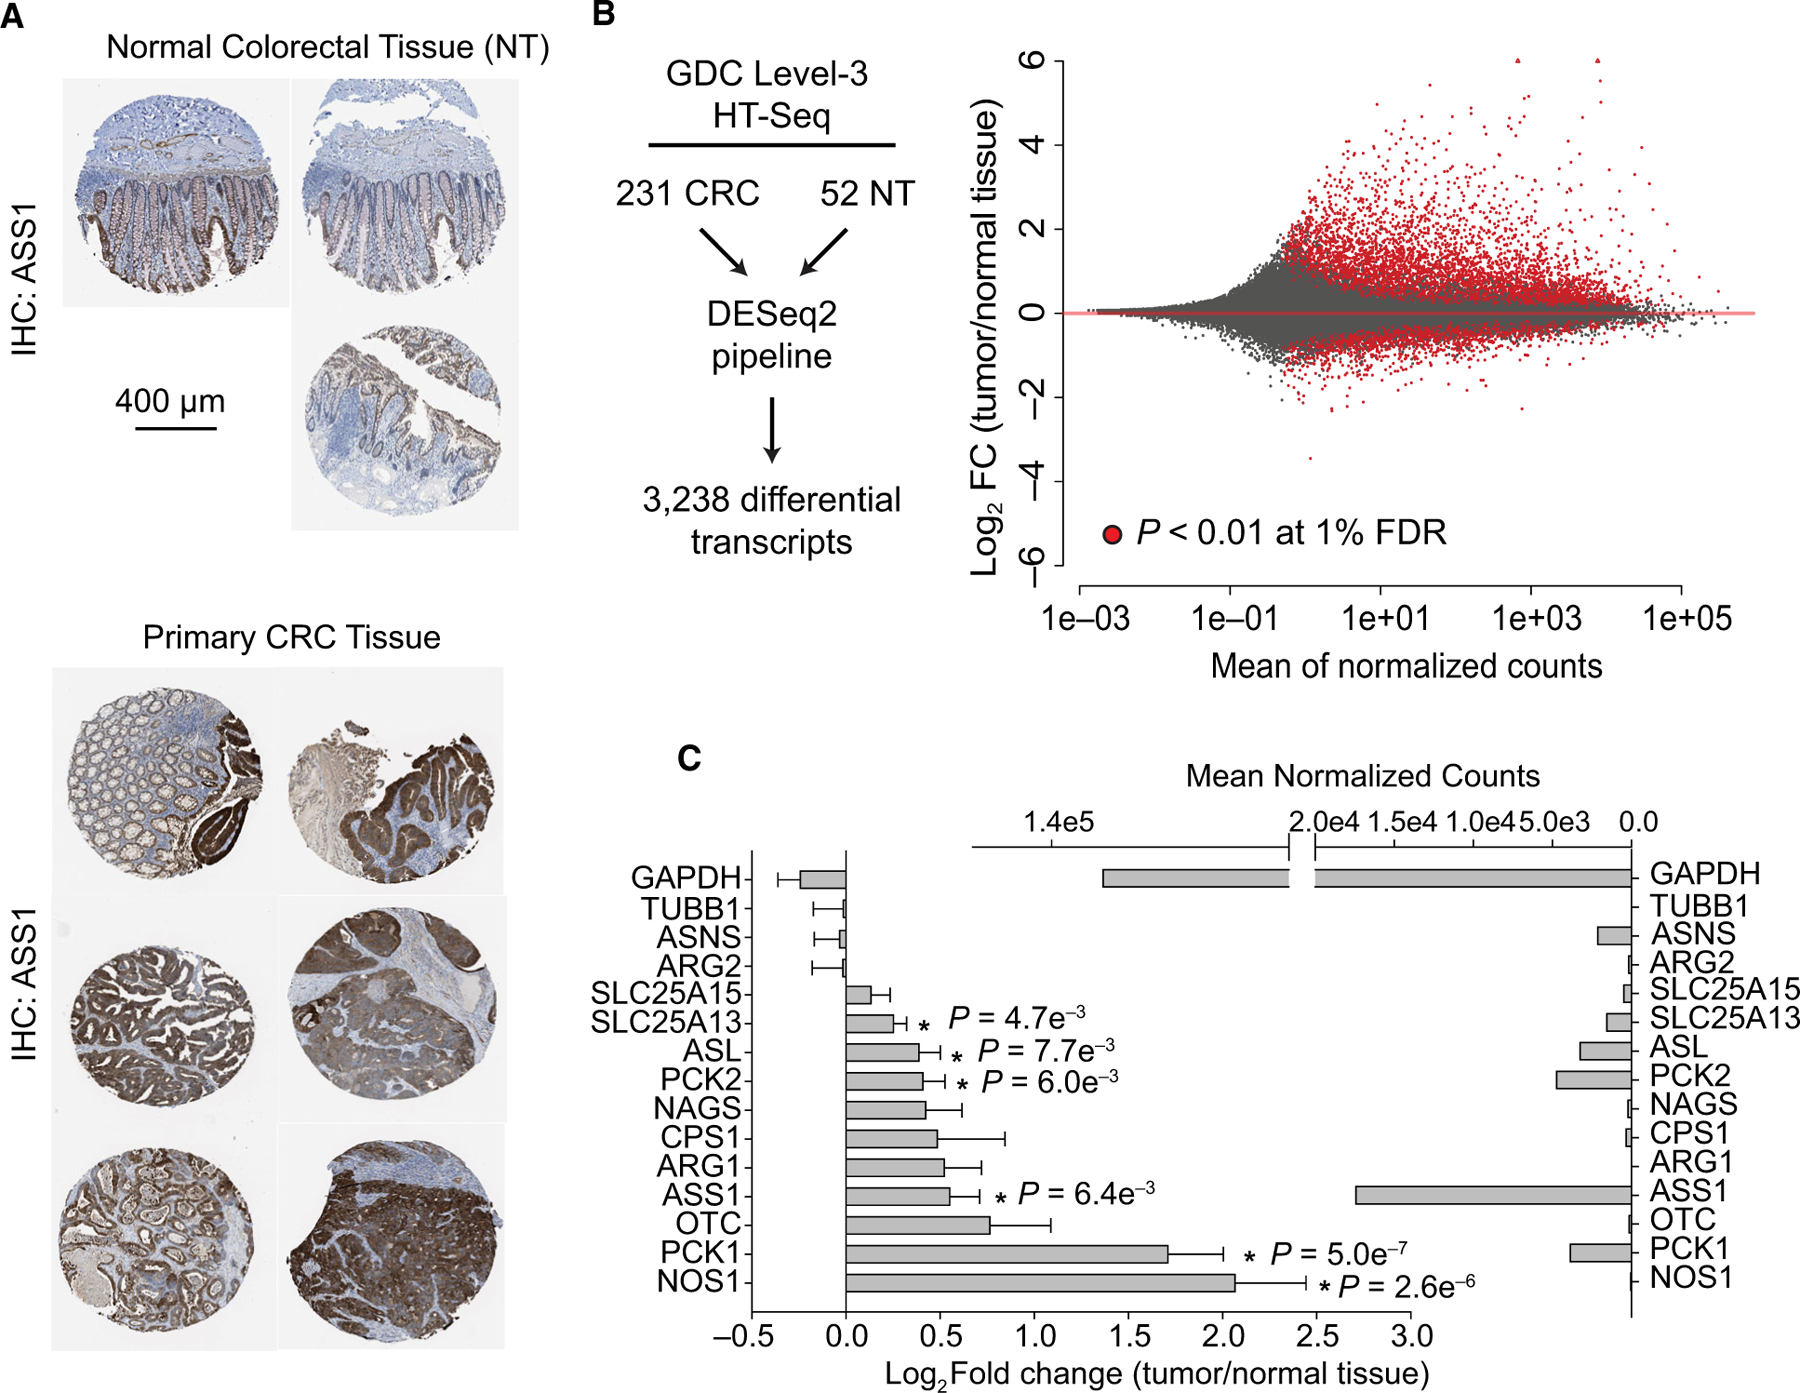
Fig. 3.

The metabolic landscape of CRC includes upregulation of urea cycle enzymes. (A) Immunochemistry against ASS1 protein for normal colorectal tissue samples and primary colorectal adenocarcinomas. A scale bar measuring 400 microns is provided for IHC images. (B) Differential expression analysis was performed using the DESeq2 pipeline on solid primary colorectal tumors (CRC, n = 231) and normal tissue (NT, n = 52) from clinical HTSeq data from the Genomic Data Commons. A Bland–Altman plot is shown with significantly changing transcripts (P < 0.01 at 1% FDR) provided in red. (C) Urea cycle enzymes and control enzymes (GAPDH and TUBB1) are shown. The log2 fold change for urea cycle enzymes and housekeeping genes was calculated, and p-values are presented at a 1% FDR cutoff. The mean normalized counts for each gene are shown. Error bars represent the standard deviation from the mean. Image credits: The Human Protein Atlas [29].
