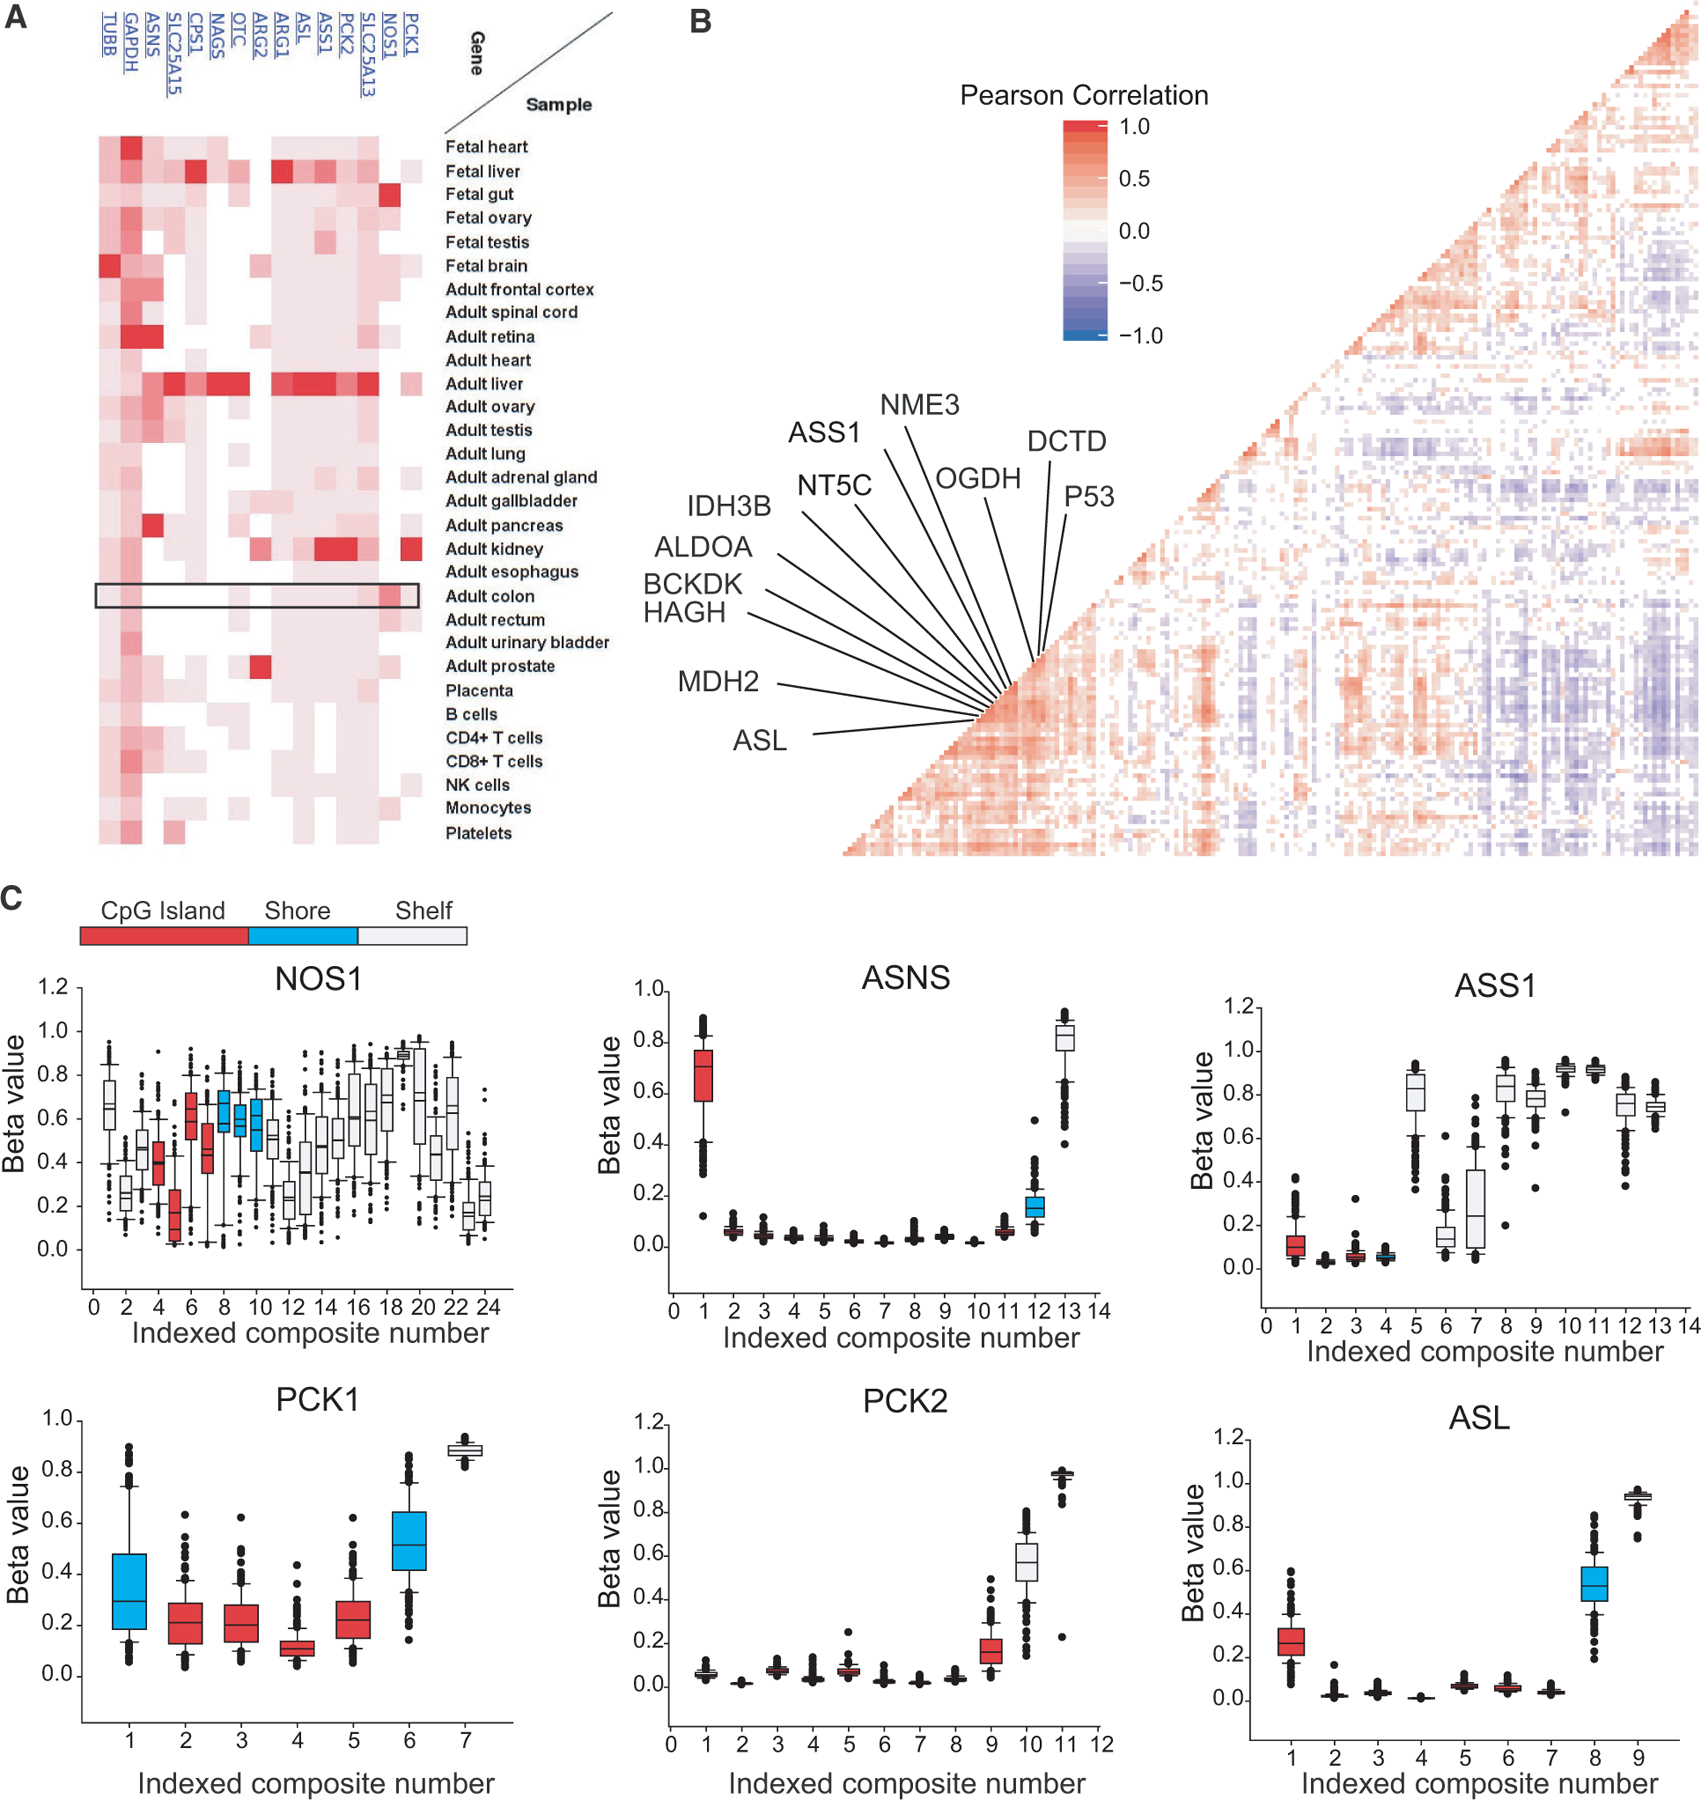
Fig. 4.

Transcript-level correlations and urea cycle enzyme methylation in CRC. (A) Expression of ASS1 and urea cycle enzymes at the protein level from [57]. (B) Correlation plot of FPKM-UQ reads from metabolic genes and commonly up- and downregulated genes from colorectal adenocarcinomas (n = 231). Significant correlations are colored and nearest neighbors to ASS1 shown. (C) Given chromosomal instability/methylation phenotypes (CIMP) in primary CRC, level-3 promotor methylation array data for all available CRC cases were examined for genes identified as central to CRC growth, and additionally NOS1. Methylation beta values are shown for genomic distances relative to transcription start sites. Composites represent unique genomic locations for which beta values were calculated. The promoter region is colored relative to the distance to the transcription start site. Error bars represent 95% confidence intervals.
