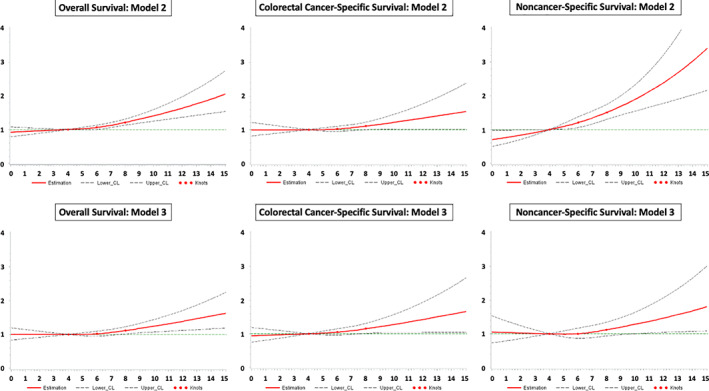
Figure 2.

Dose‐response curves for the associations of the number of drugs with overall, colorectal cancer–specific, and non‐cancer‐specific survival in model 2 (without adjustment for functional status and comorbidity) and model 3 (full model). The dose‐response curves for model 3 were obtained from the imputation data set 1.Abbreviation: CL, confidence limit.
