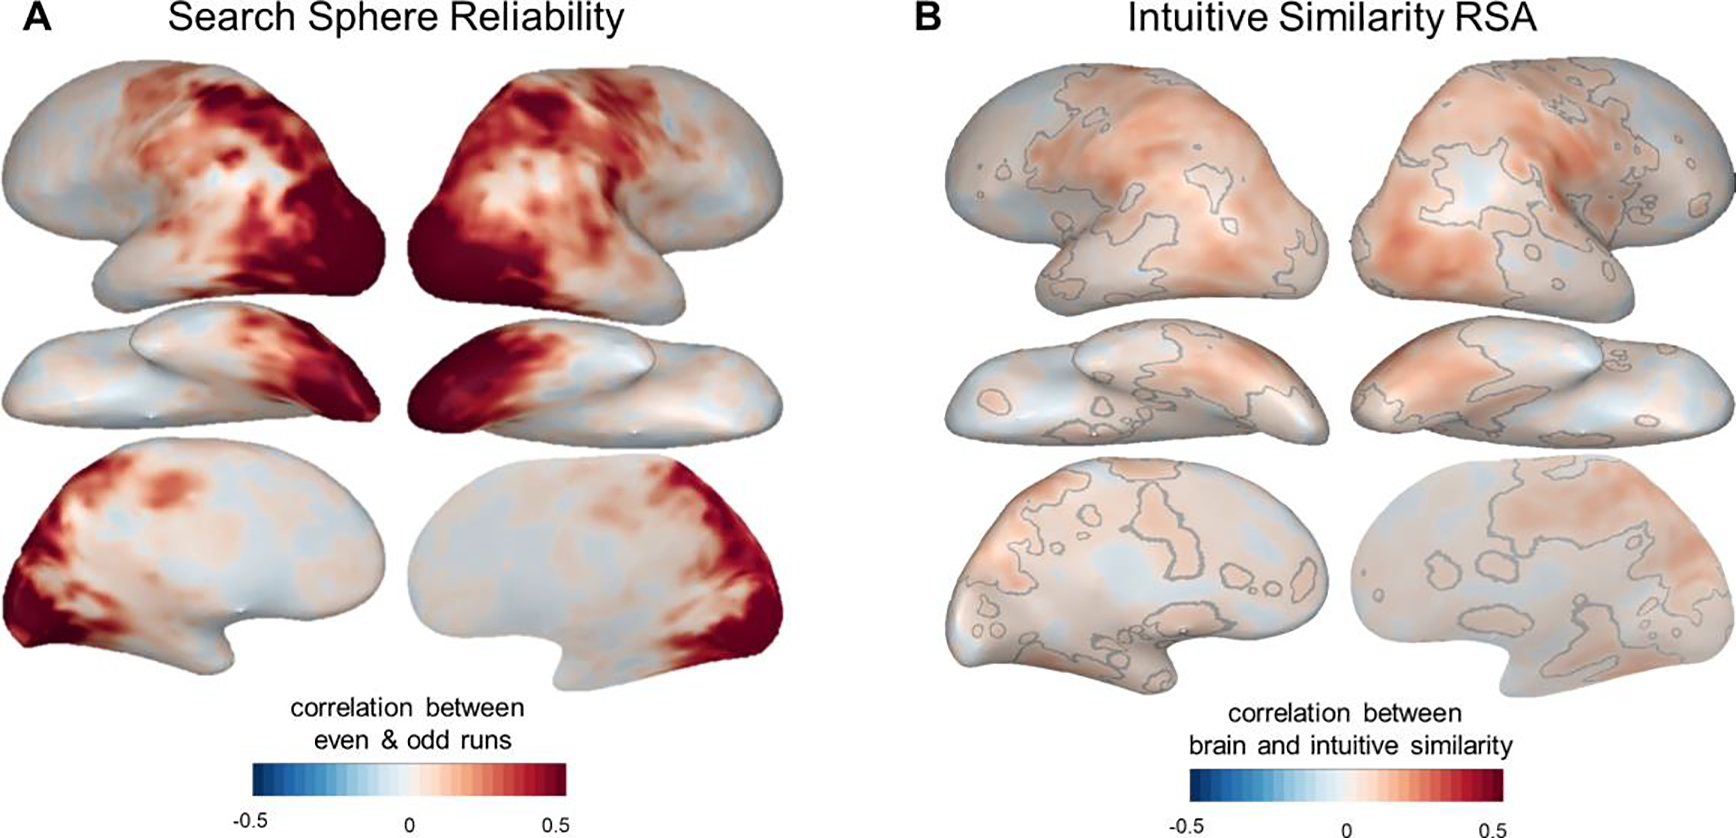
Figure 3: Exploratory Searchlight Analysis.

Whole-brain searchlight analyses were used to compare intuitive similarity judgments to neural responses measured in a separate fMRI experiment (Tarhan and Konkle, 2020b). (A) Searchlight split-half reliability map, showing the correlations between neural dissimilarity matrices calculated based on even- and odd-numbered imaging runs (see Methods). We have higher confidence in the Representational Similarity Analysis results in voxels with higher searchlight reliability. (B) Searchlight results comparing neural response geometries to intuitive judgments of action similarity. Grey lines outline the voxels that survived statistical corrections (voxelwise permutation tests at p < 0.01, cluster-level permutation tests at q < 0.05).
