
Figure 4: Visualizing the Action Processing Hierarchy.
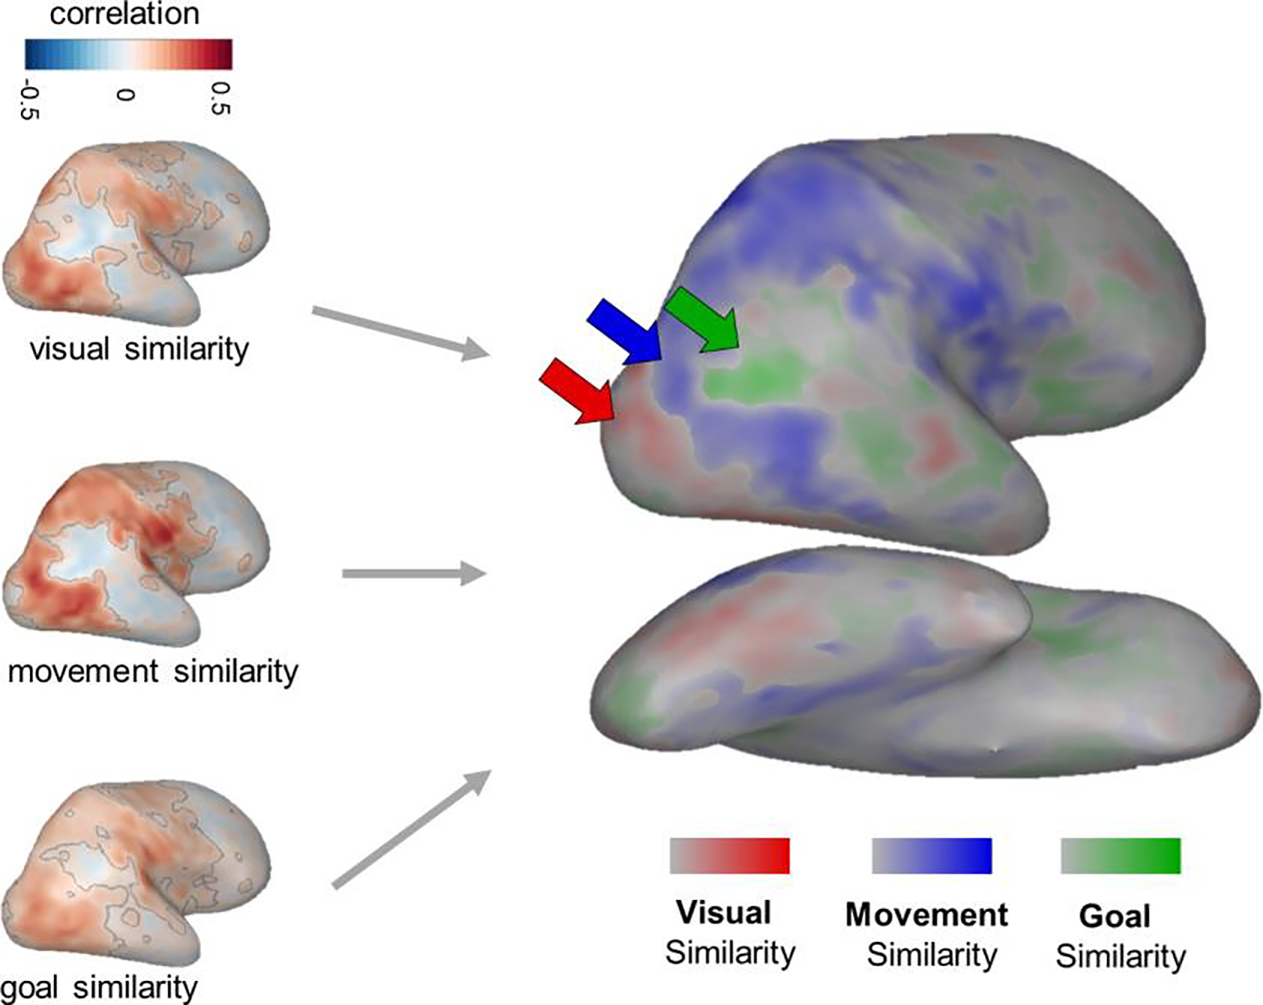
To understand which brain regions are most related to each of the hypothesized kinds of action similarity, separate Representational Similarity Analyses were conducted comparing each of the three model RDMs to neural responses. RSA results for each model RDM are shown on the left, with significant voxels outlined in grey. A 3-way winner map (right) was calculated by identifying the model RDM with the highest positive correlation to each searchlight and coloring the searchlight’s central voxel according to that RDM. The intensity of the color indicates the difference between the strongest and next-strongest correlation.